Table of Contents
- Getting Started
- Agent-Based Monitoring
- Data Providers
- Directory Services
- Auditing
- Hosts
- Templates
- Template Properties
- Batch Update Templates
- Log Management Templates
- File and Directory Monitor Templates
- Windows Monitor Templates
- Account Lockout Monitor Template
- Logon Monitor Template
- CPU Monitor Template
- Memory Monitor Template
- Disk Space Monitor Template
- SMART Monitor Template
- Windows Update Template
- Process Monitor Template
- Service Monitor Template
- Performance Counter Monitor Template
- PowerShell Template
- Registry Value Monitor Template
- Active Directory User Monitor Template
- Active Directory User Integrity Monitor Template
- Task Scheduler Template
- Clock Synchronization Template
- Defragment NTFS Disks Template
- Network and Application Monitor Templates
- Database Monitor Template
- Directory Service Monitor Template
- DNS Blacklist Monitor Template
- DNS Monitor Template
- Domain Expiration Monitor Template
- Network Speed Monitor Template
- Ping Monitor Template
- Database Table Reseed
- SQL Server Shrink and Backup Template
- SSH Shell
- TCP Port Scan Monitor Template
- Website Monitor Template
- SSL Certificate Monitor Templates
- Email Monitor Templates
- SNMP Monitor Templates
- Monitors
- Reports
- Auto-Configurators
- Filters
- Actions
- Desktop Actions
- Email Actions
- Event Log Actions
- Executable Actions
- File Actions
- IIS IP Address Restriction Actions
- Microsoft Teams Actions
- PowerShell Actions
- Report Actions
- Service Actions
- SMS Actions
- SNMP Trap Actions
- Syslog Actions
- Template Actions
- IIS IP Address Restriction Actions
- Action Variables
- Schedules
- Environment Variables
- Options
- Account Lockout Monitoring and Reporting
- Merging Logs
- SNMP
- SSH Shell
- Syslog
- Exporting and Importing Configuration Objects
- Shared Views
- Auto-Config Host Assignment Properties
- General Executable Properties
- Assign Actions
- Assign Directories
- Assign Disks
- Assign Shares
- Assign Files
- Assign Consolidated Logs
- Assign Event Logs
- Assign Azure Audit Logs
- Target Files and Sub-Directories
- Define Log Entry Columns
- Define Log Entry Columns with Regular Expressions
- Define CSV and W3C Log Entry Columns
- Active Directory User and Group Filters
- Explicitly Assigned Logs
- File Explorer
- Report Columns
- Report Date/Time Ranges
- Report Security Event Log Filters
- Select Folder or File
- Executable Timeline
- Command Line Interface
- Troubleshooting
- Terminology
Corner Bowl Server Manager
SIEM, IPS, Server Monitoring, Uptime Monitoring and Compliance Software
Executable Timeline View
The Executable Timeline View enables you to graphically view the execution frequency, execution exclusion rules and status of Monitors, Reports and Auto-Configurators. When viewing uptime monitors (e.g. Ping Monitors), that run more than once a minute (e.g. Every 15 Seconds), the view displays concatenates results. Once concatenated, the view acts as a graphical uptime monitor viewer.
To view the Timeline for a Monitor:
- From the Explorer View, find the root Hosts node then locate the target host and expand. Once expanded, expand the Templates node. Find the target monitor then right click and select Explore. The Monitor Status View displays.
- From the Monitor Status View, select the Timeline Tab
To view the Timeline for a Report or Auto-Configurator:
- From the Explorer View, find the target Report or Auto-Configurator node then right click and select Explore. The Status View displays.
- From the Status View, select the Timeline Tab
The Timeline Tab:
The History Control:
The History Control graphically displays each event that has been logged to the history.
- Use your mouse to view the detail of each data point.
- Use the Level checkboxes to show and hide specific levels and monitor status.
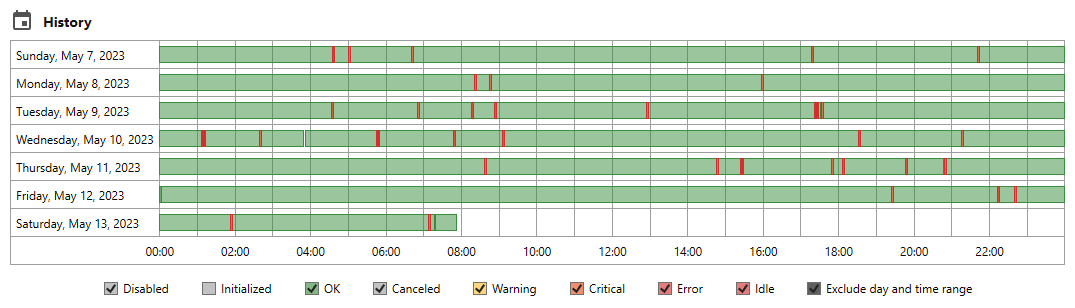
Sample Uptime Ping Monitor Control
The Data Summary Control:
The Data Summary Control displays metadata about the database history table including:
- The history database table name.
- The date and time range contained within the history.
- Number of days saved in the history.
- Total number of log events saved in the history.
- Daily average number of history log events.
- The history table size.
- The name of template specific data columns (e.g. PING_RESPONSE_TIME, LOAD, SIZE) included in the history table for use in external BI Dashboards.
- The data types associated with each template specific data column.
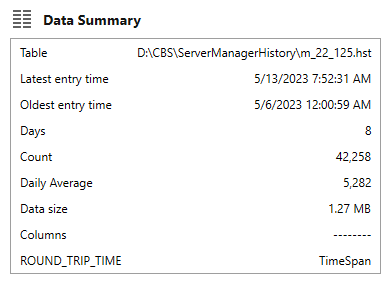
Sample Data Summary Control