Table of Contents
- Getting Started
- Agent-Based Monitoring
- Data Providers
- Directory Services
- Auditing
- Hosts
- Templates
- Template Properties
- Batch Update Templates
- Log Management Templates
- File and Directory Monitor Templates
- Windows Monitor Templates
- Account Lockout Monitor Template
- Logon Monitor Template
- CPU Monitor Template
- Memory Monitor Template
- Disk Space Monitor Template
- SMART Monitor Template
- Windows Update Template
- Process Monitor Template
- Service Monitor Template
- Performance Counter Monitor Template
- PowerShell Template
- Registry Value Monitor Template
- Active Directory User Monitor Template
- Active Directory User Integrity Monitor Template
- Task Scheduler Template
- Clock Synchronization Template
- Defragment NTFS Disks Template
- Network and Application Monitor Templates
- Database Monitor Template
- Directory Service Monitor Template
- DNS Blacklist Monitor Template
- DNS Monitor Template
- Domain Expiration Monitor Template
- Network Speed Monitor Template
- Ping Monitor Template
- Database Table Reseed
- SQL Server Shrink and Backup Template
- SSH Shell
- TCP Port Scan Monitor Template
- Website Monitor Template
- SSL Certificate Monitor Templates
- Email Monitor Templates
- SNMP Monitor Templates
- Monitors
- Reports
- Auto-Configurators
- Filters
- Actions
- Desktop Actions
- Email Actions
- Event Log Actions
- Executable Actions
- File Actions
- IIS IP Address Restriction Actions
- Microsoft Teams Actions
- PowerShell Actions
- Report Actions
- Service Actions
- SMS Actions
- SNMP Trap Actions
- Syslog Actions
- Template Actions
- IIS IP Address Restriction Actions
- Action Variables
- Schedules
- Environment Variables
- Options
- Account Lockout Monitoring and Reporting
- Merging Logs
- SNMP
- SSH Shell
- Syslog
- Exporting and Importing Configuration Objects
- Shared Views
- Auto-Config Host Assignment Properties
- General Executable Properties
- Assign Actions
- Assign Directories
- Assign Disks
- Assign Shares
- Assign Files
- Assign Consolidated Logs
- Assign Event Logs
- Assign Azure Audit Logs
- Target Files and Sub-Directories
- Define Log Entry Columns
- Define Log Entry Columns with Regular Expressions
- Define CSV and W3C Log Entry Columns
- Active Directory User and Group Filters
- Explicitly Assigned Logs
- File Explorer
- Report Columns
- Report Date/Time Ranges
- Report Security Event Log Filters
- Select Folder or File
- Executable Timeline
- Command Line Interface
- Troubleshooting
- Terminology
Corner Bowl Server Manager
SIEM, IPS, Server Monitoring, Uptime Monitoring and Compliance Software
General Executable Properties
The General tab, found in the Template, Report and Constant Delivery Pipeline property views, contains name and schedule properties.
- Use the Name text box to specify a unique name.
- Use the Auto-Generate Name
 button to generate a name based on the object's properties.
 - Use the Enabled checkbox to schedule execution of this object.
- Use the Re-enable checkbox to configure the software to automatically re-enable disabled objects once the configured period has expired.
- Check the Restart option to automatically restart monitors and reports that are executing when the service is restarted.
-
Check the Auto-execute option to automatically start monitors and reports when the service starts when previously scheduled to execute when the service was shutdown.

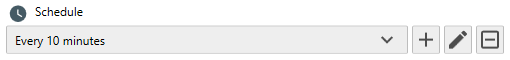
The feature, for example, enables air gapped servers to automatically execute Event Log File Backups scheduled to run when the system was turned off. - The Select Schedule drop-down includes a drop-down button and a plus button. For more information see: Schedules
- Use the Drop-Down button to select an already existing schedule.
- Use the Plus button to add a new schedule to the system.
- Some templates enable you to specify a retry schedule when the associated monitor is triggered or errors. Use the Retry Schedule drop-down to schedule the frequency to re-run the monitor until at some future time the monitor recovers from the triggered state or the triggered state is cleared.
-
Some templates enable you to specify a failure rate.
The failure rate enables you to require a set number of triggers or error over a period of time prior to triggering actions.
Use the Failure rate controls to enable and set the number of triggers or errors that must occur with a period of time.
A use case for this option is found in the default settings of the Ping Monitor Template. Since ping tests regularly fail, with an execution schedule of every 5 seconds this option is set to require 3 failures within 20 seconds. This configuration minimizes or even eliminates false positives by deferring the trigger 10 seconds after the first failure for a total time of 15 seconds. - When viewing Report Properties, use the Auto-open checkbox to automatically open the report immediately after logging into the Management Console.
-
Use the Retain history option to specify the length of time to retain execution history and results.
When monitoring CPU every minute, for example, you may want to consider setting the range to a lower number such as 7 days so the history view can quickly display while also removing data no longer needed. When downloading and saving Event Logs consider setting the value to something larger such as 6 months so an audit trail is left behind.