Log Monitoring with Event Log Manager 2026
In this article I am going to show you various log monitoring functions Event Log Manager 2021 (ELM) offers, how to view the logs, create filters from existing log entries, assign alerts and actions, for example sending an email notification, and finally how to review the history of events.
ELM supports the following log monitors:
- Windows Event Logs
- Syslogs
- Text or Application Logs
- Azure Active Directory Audit logs
Table of Contents
Log Monitoring Overview
There are several ways to setup log monitoring however I find the easiest method is to:
| Add the log to the software: | Create a new Log Monitor template that defines the target log but does not contain filter/action rules. |
| Watch the log in real-time: | Open the real-time log viewer to view the current log entries. |
| Trigger the event: | Manually trigger the event that generates the target log entry or push a simulated log entry using a Server Manager Action such as Write to an Event Log |
| Create the filter: | After receiving the target log entry in the real-time viewer, use the log entry as a template to create a new Filter |
| Update the log monitor template: | Once the filter is created, assign a new filter/action rule to the log monitor template. |
| Test the log monitor template: | Trigger the event or simulate the log entry then verify your action, such as Send an Email is executed. |
| Troubleshoot: | If the action is not executing, view the log monitor history and resolve any errors. |
Event Log Monitoring
First, we will create an empty log monitor template so we can view the Event Log in real-time. Select File > New. The Create New Object view displays.
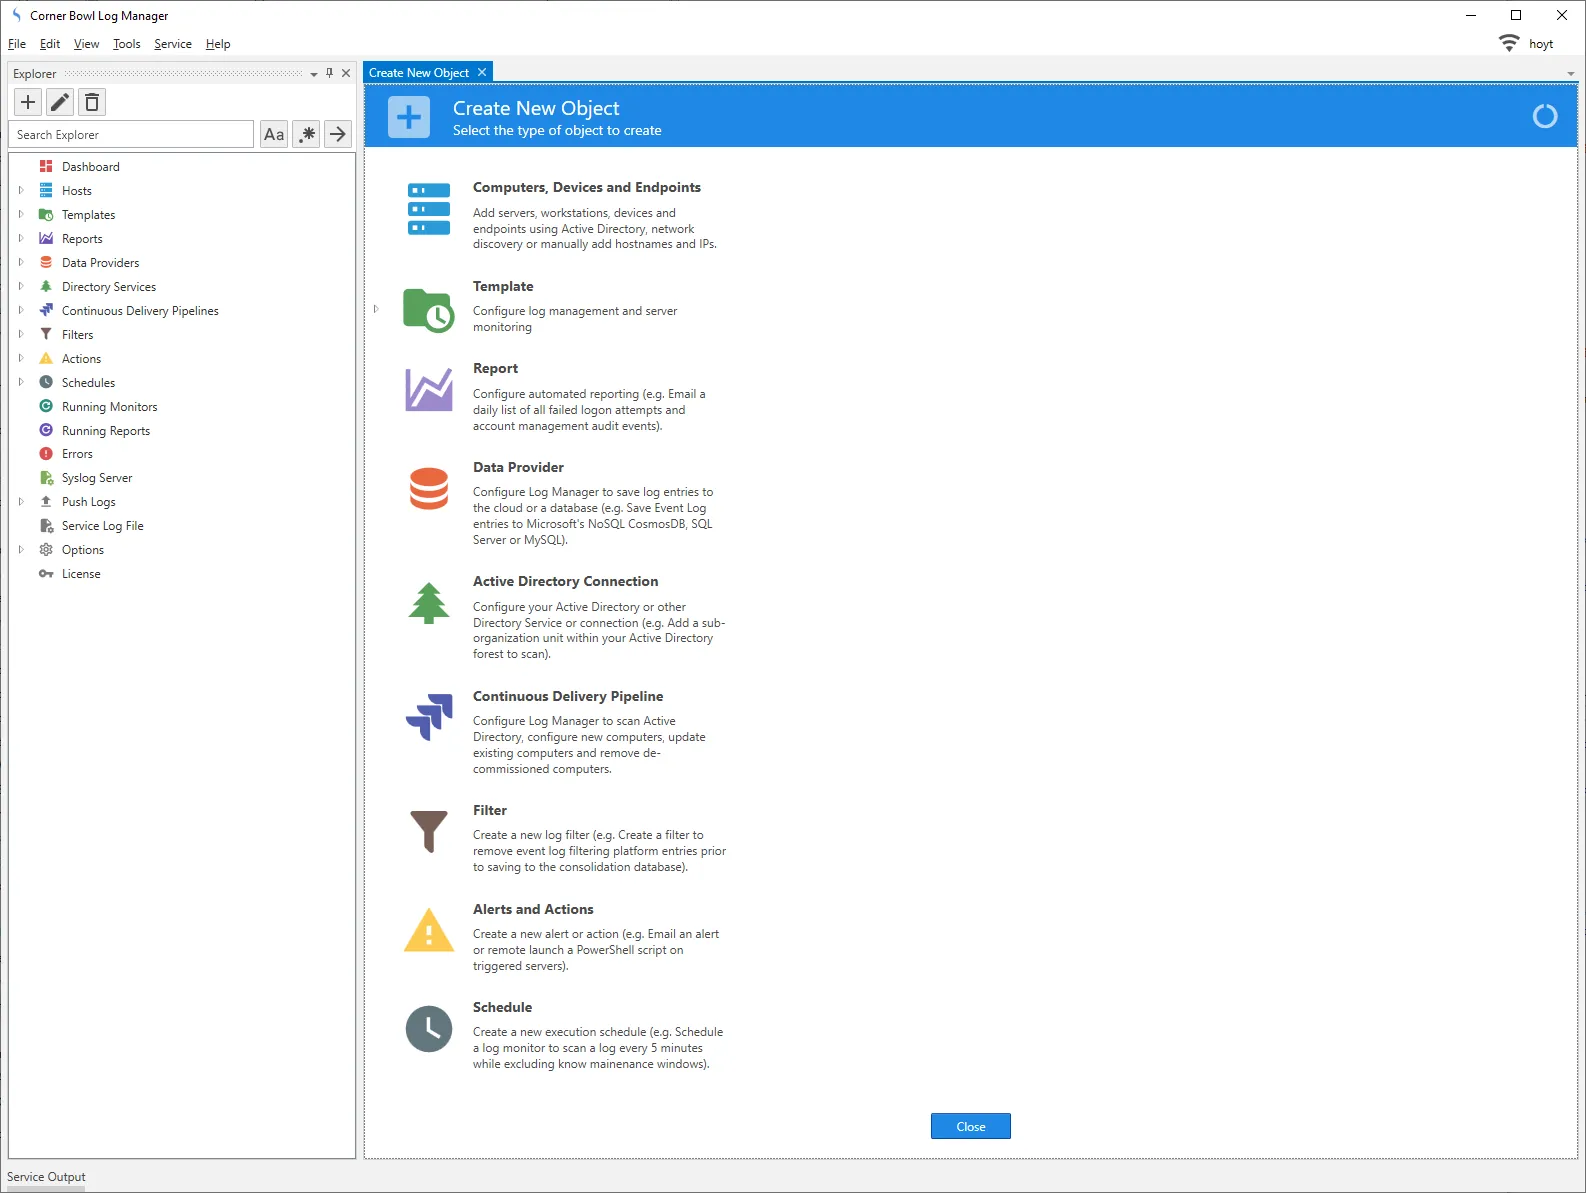
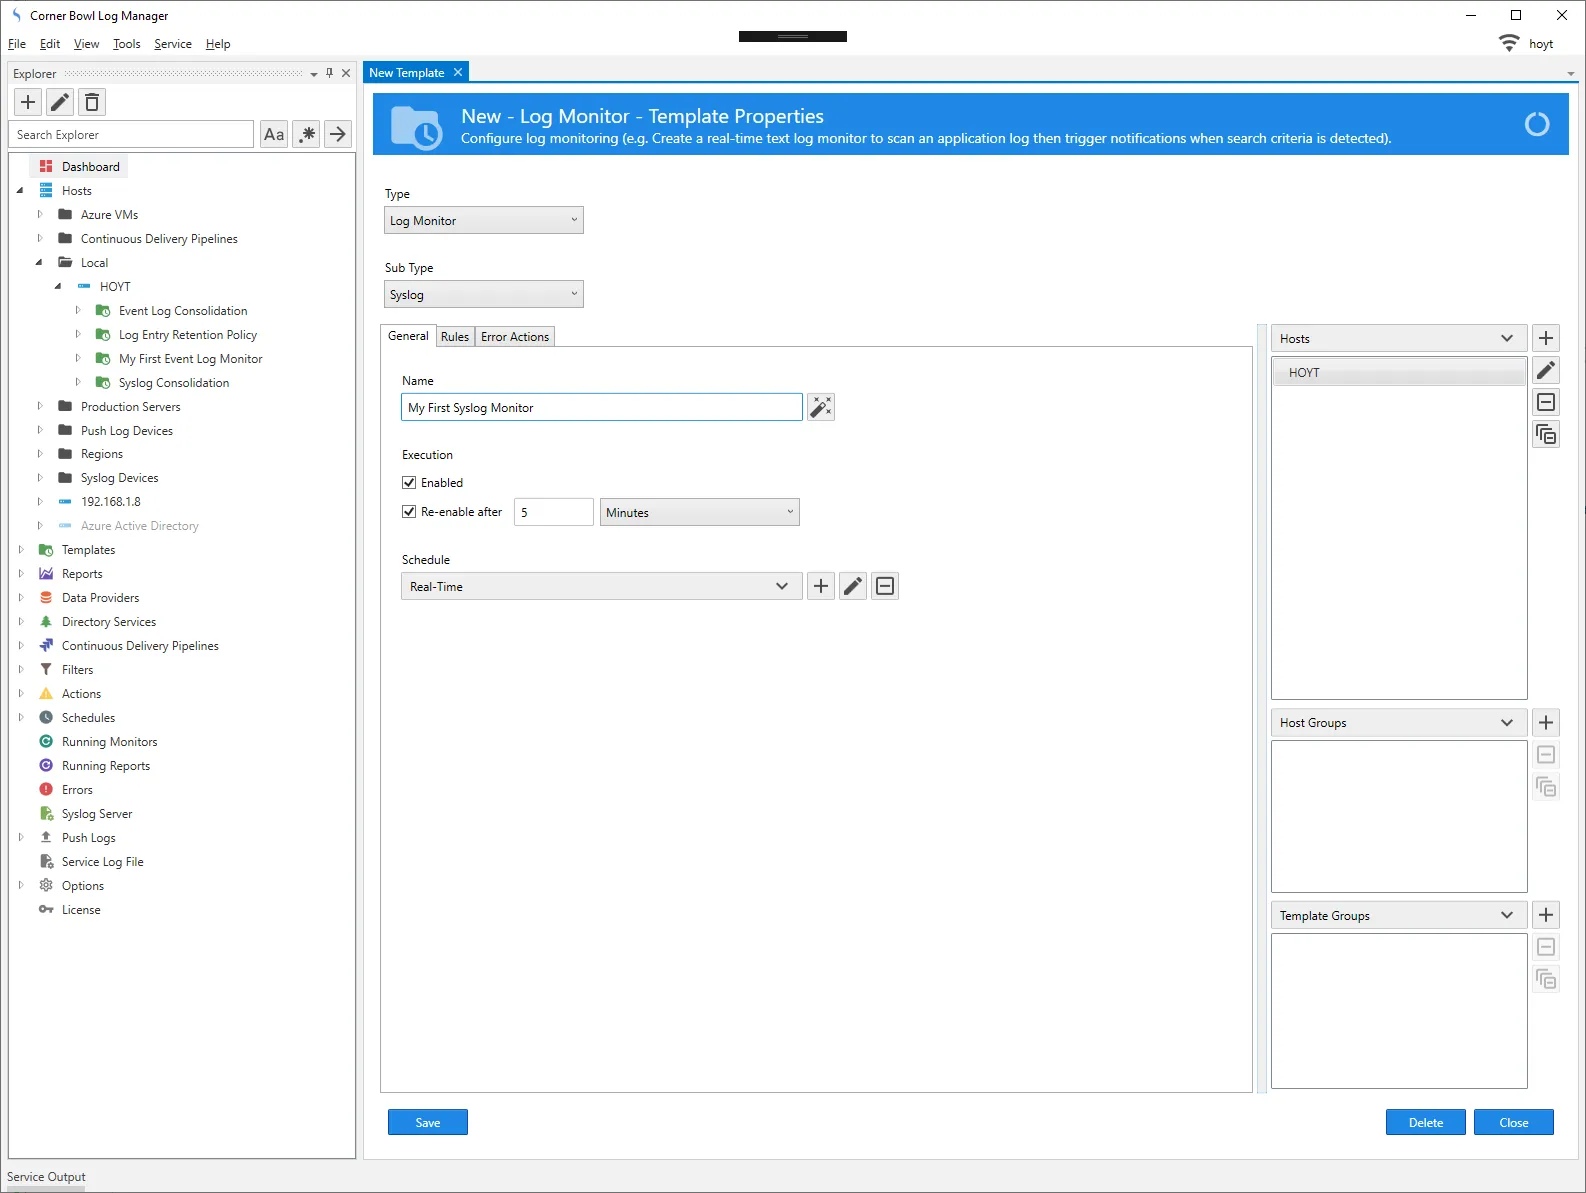
Expand Template then select Log Monitor. The New Template view displays.
Under Sub-Type select Event Log.
Specify a friendly name.
Select a schedule. The Event Log Monitor supports either a Real-Time or Fixed (e.g. Every 01 Minutes) type.
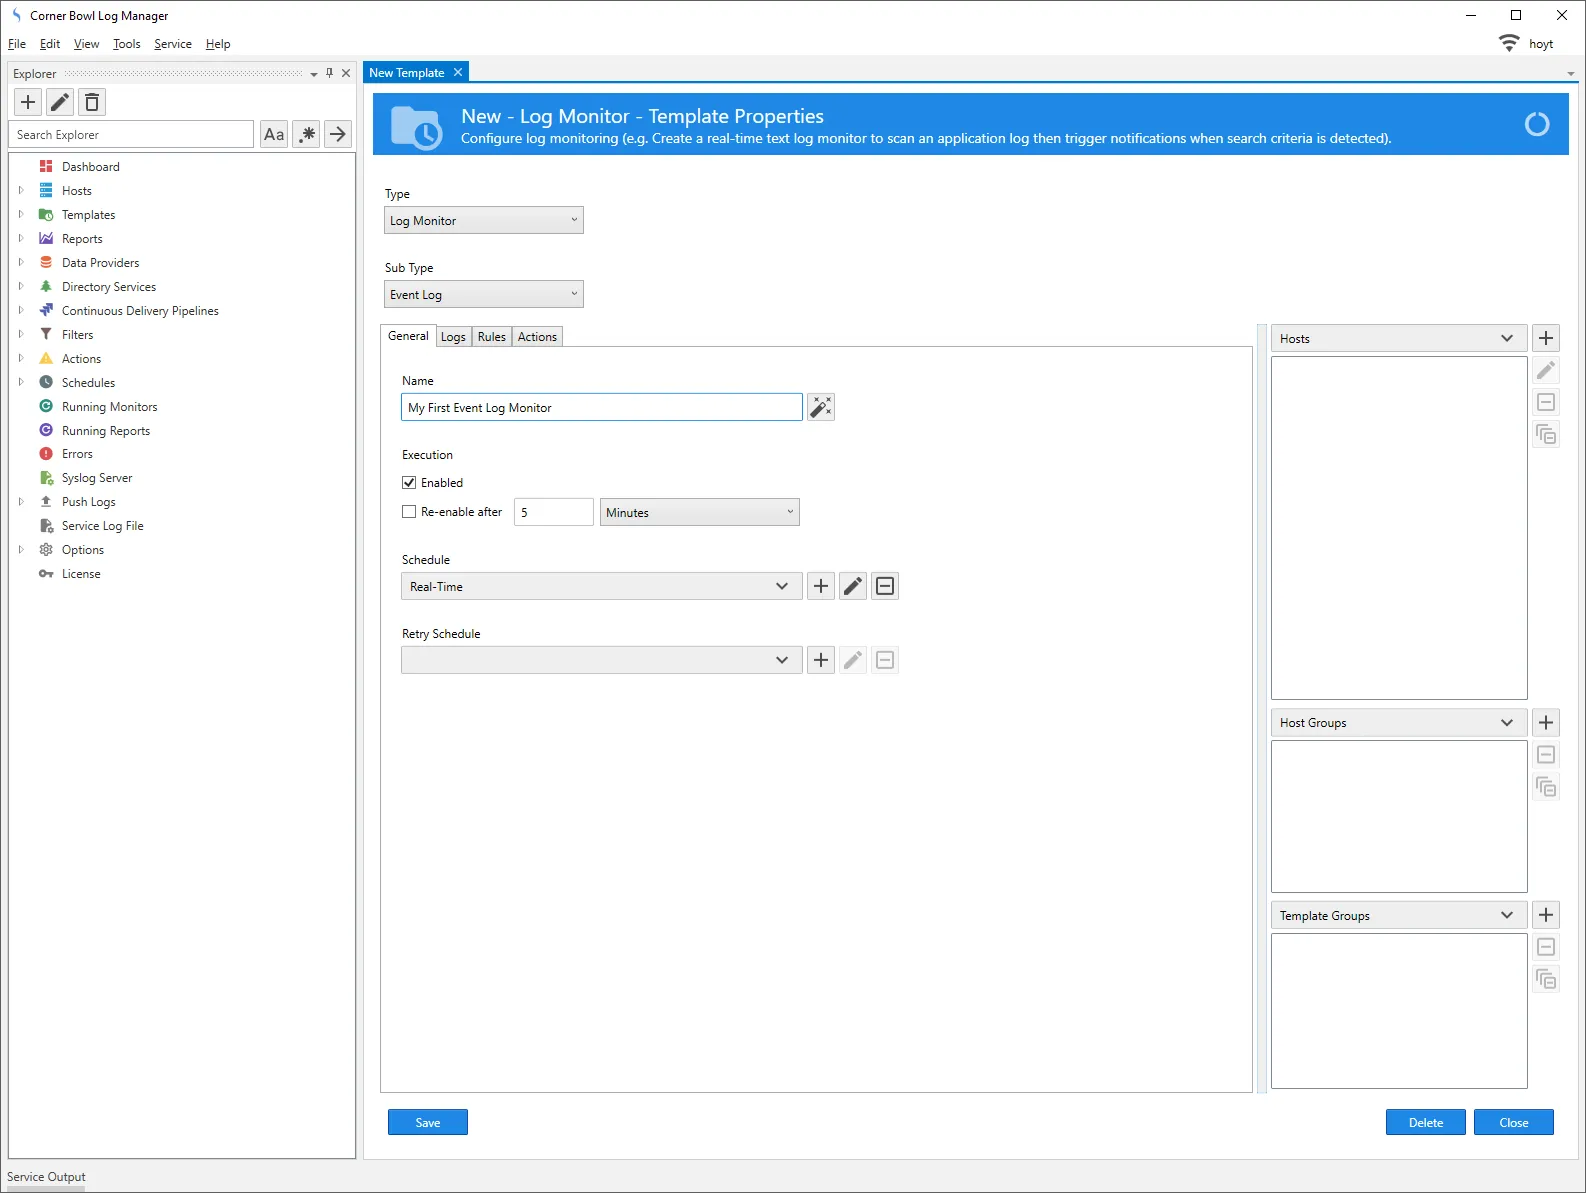
Select the Logs tab and check the logs you would like to monitor.
Lastly, assign the host that contains the file. Click Close and save your changes.
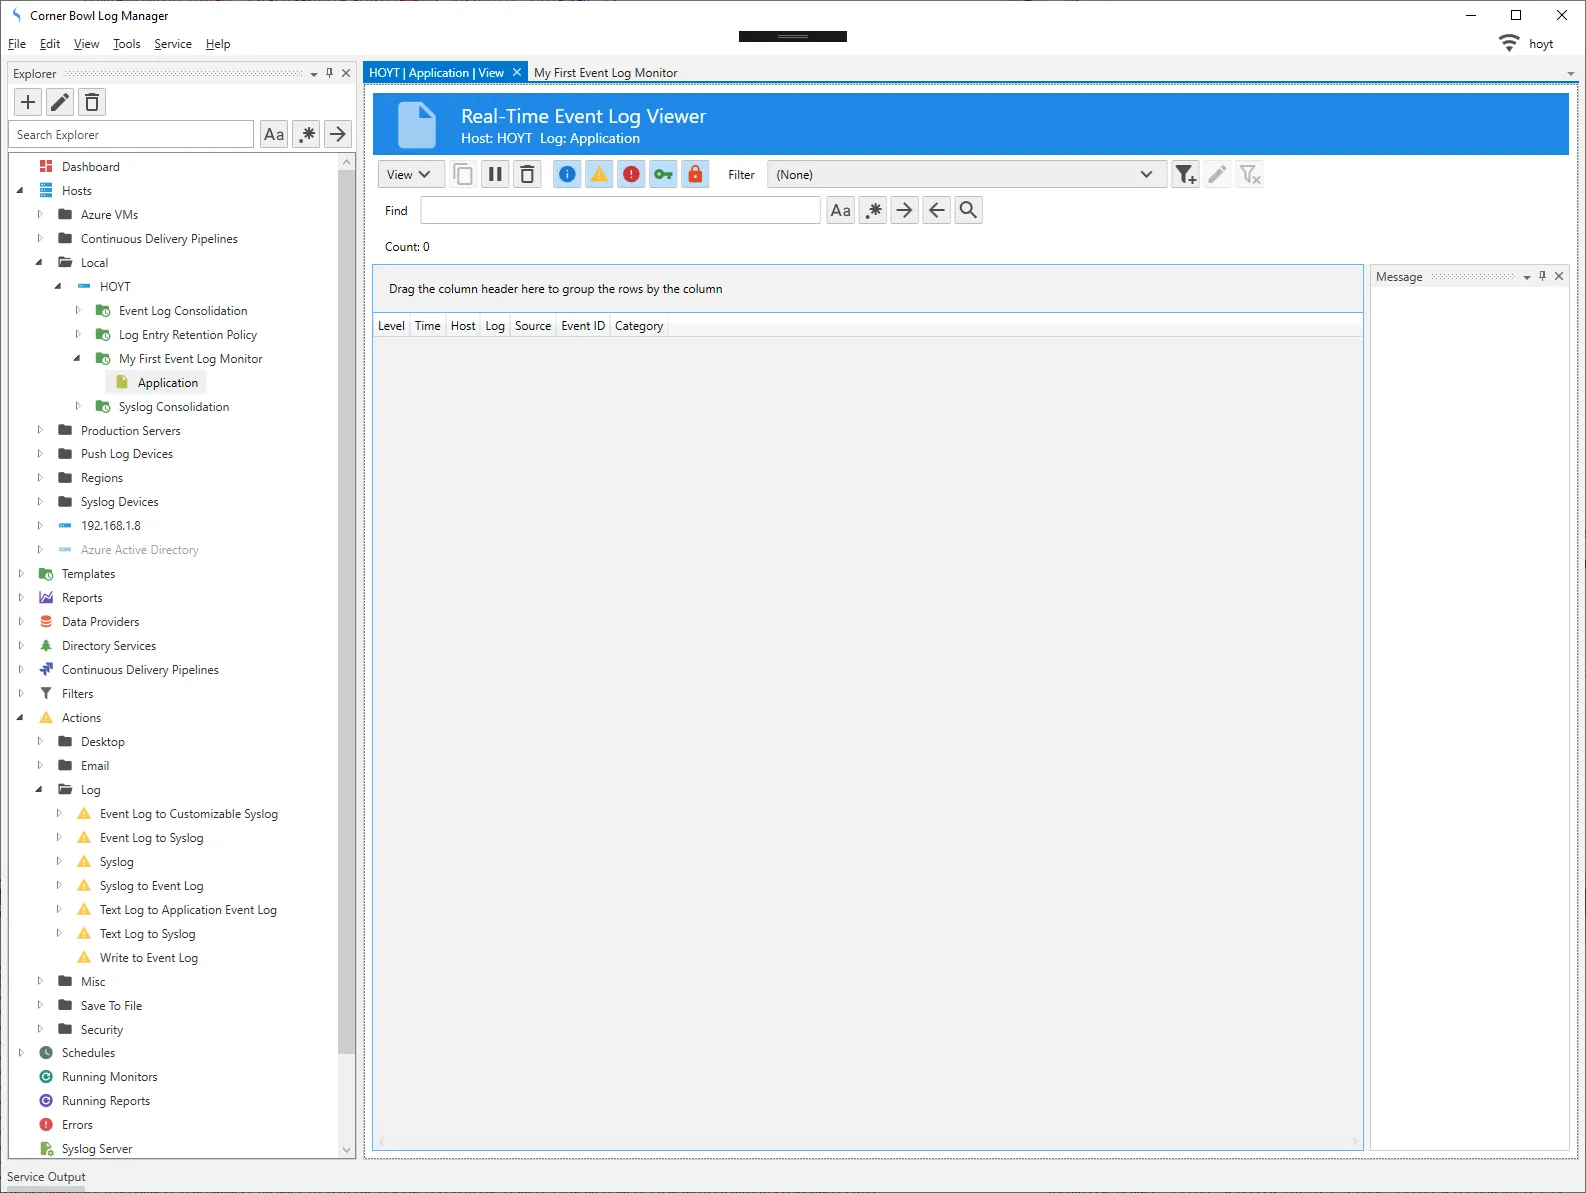
Next, we will open the Real-Time Event Log Viewer. From the Explorer view, expand the host, locate and expand the template, then right click on the log listed below and select Watch. The Real-Time Event Log Viewer displays.
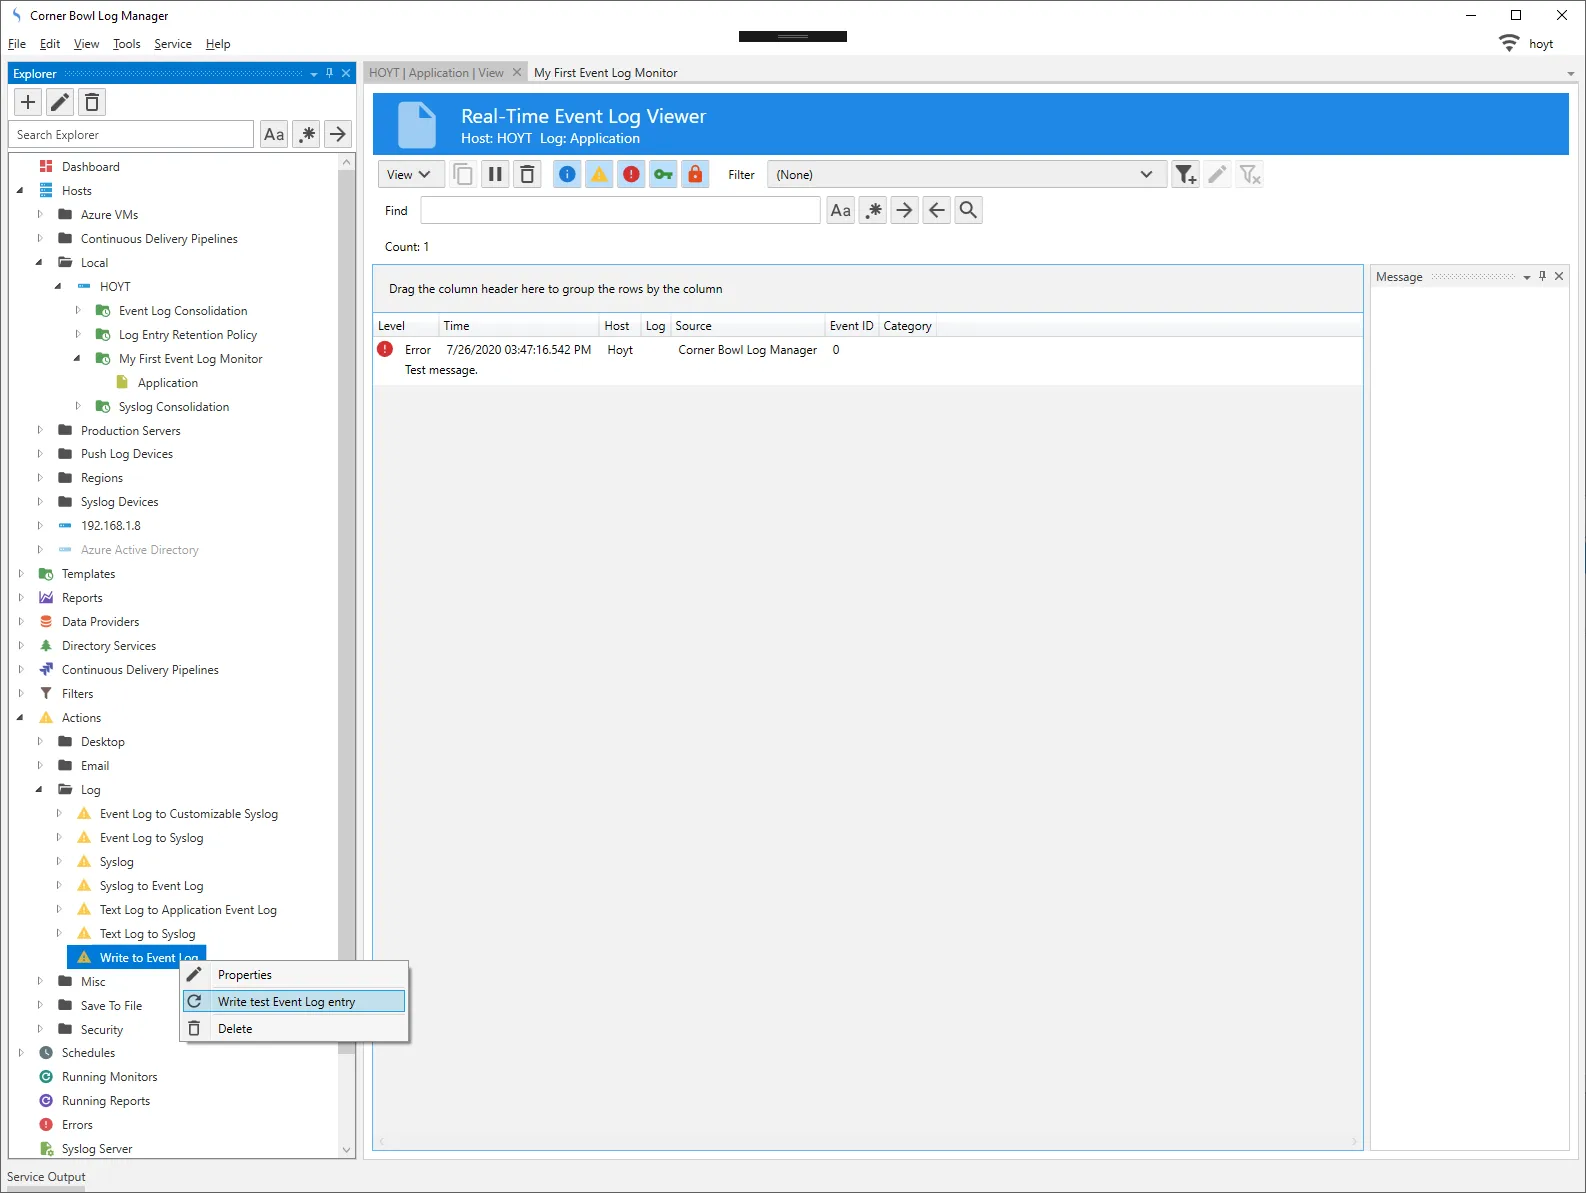
Now manually trigger the event of interest so the log entry is generated. If you are unable to manually trigger the event you can modify the Write to Event Log action to simulate the event. The pre-installed action is located at: \\Actions\Log\Write to Event Log. Right click on the action and select Properties. Make the necessary changes, click the Save button then the Test button.
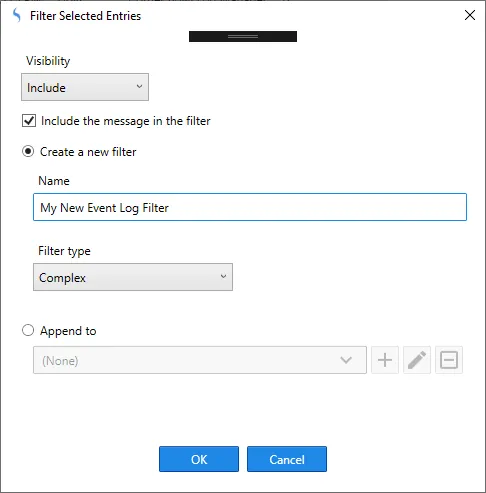
Now back in the viewer we should see the target entry. If the viewer is flowing with new log entries, quickly click the Pause button so the log entry does not scroll off the screen. Right click on the log entry and select Filter Selected Entries. The Filter Selected Entries dialog displays.
You have several options here. You have the option to include or exclude the entries, include the message in the filter as well as create a new filter or append to an existing filter. We are going to leave the default options and specify a Name for example, My New Event Log Filter.
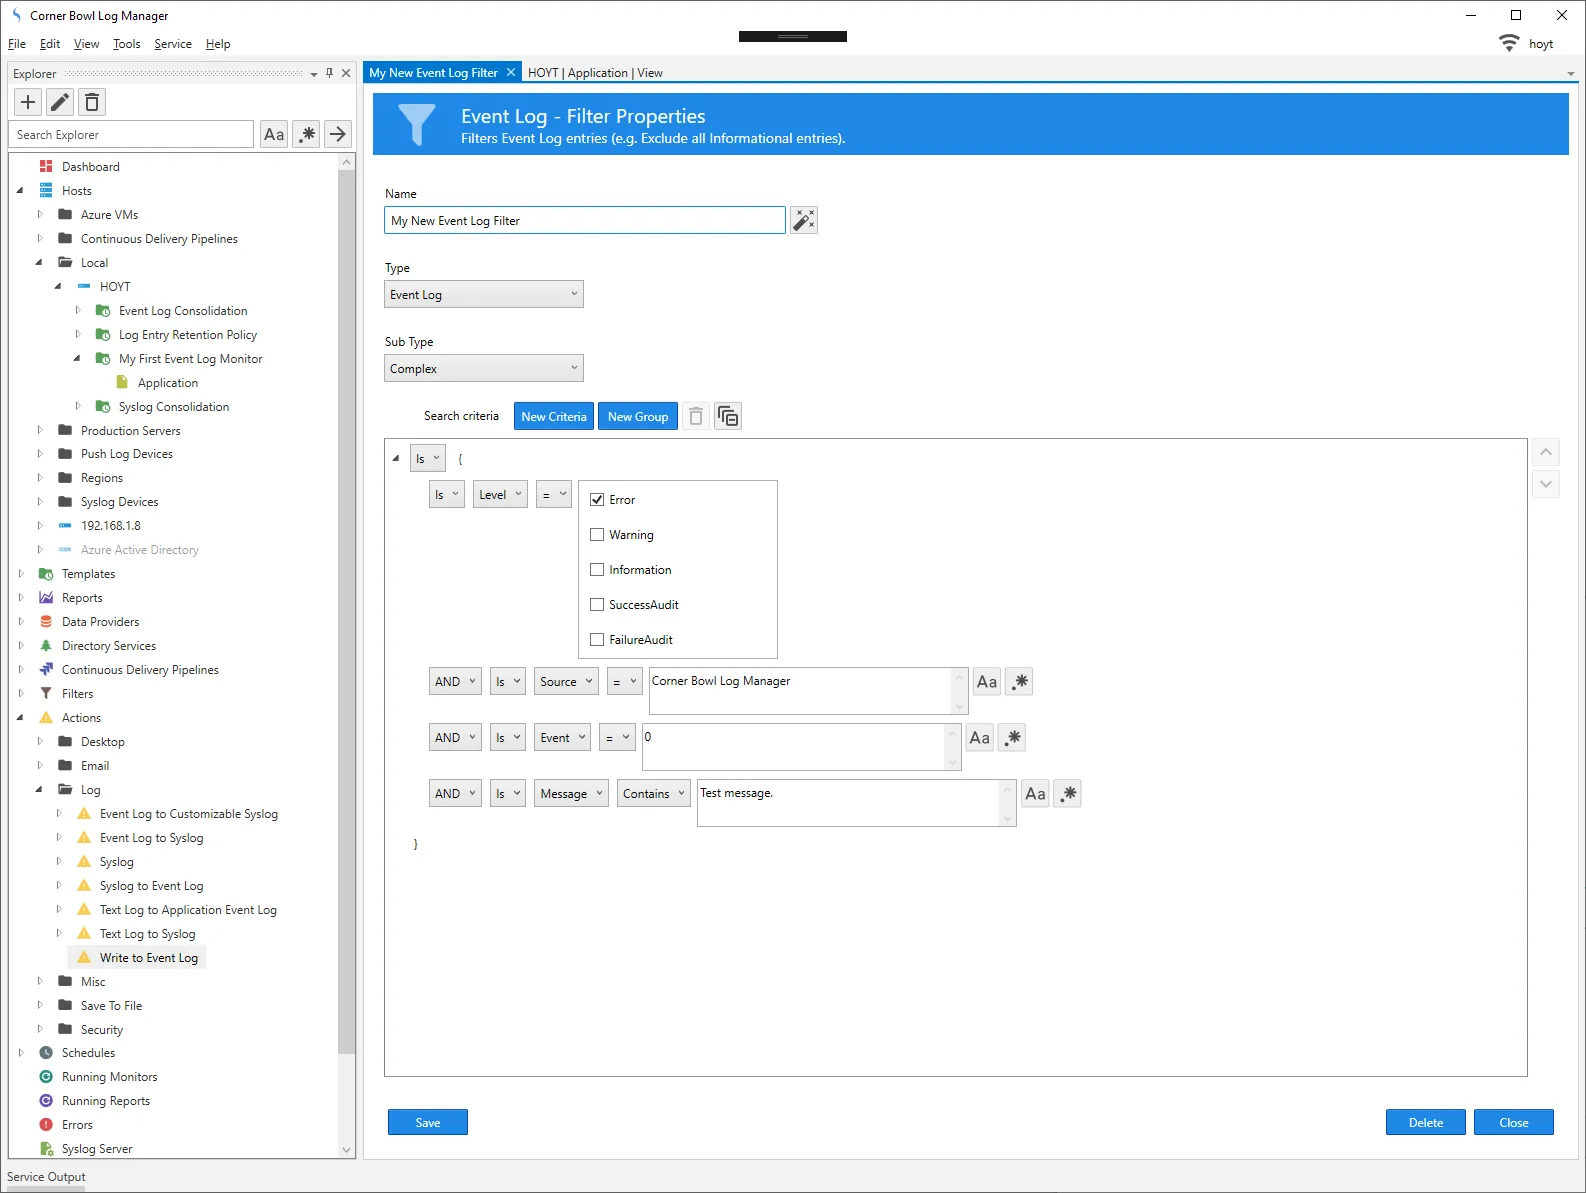
Once created the Event Log - Filter Properties view displays. Here you can fine tune the filter. A typical scenario involves removing specific content from the message criteria while leaving the generic content.
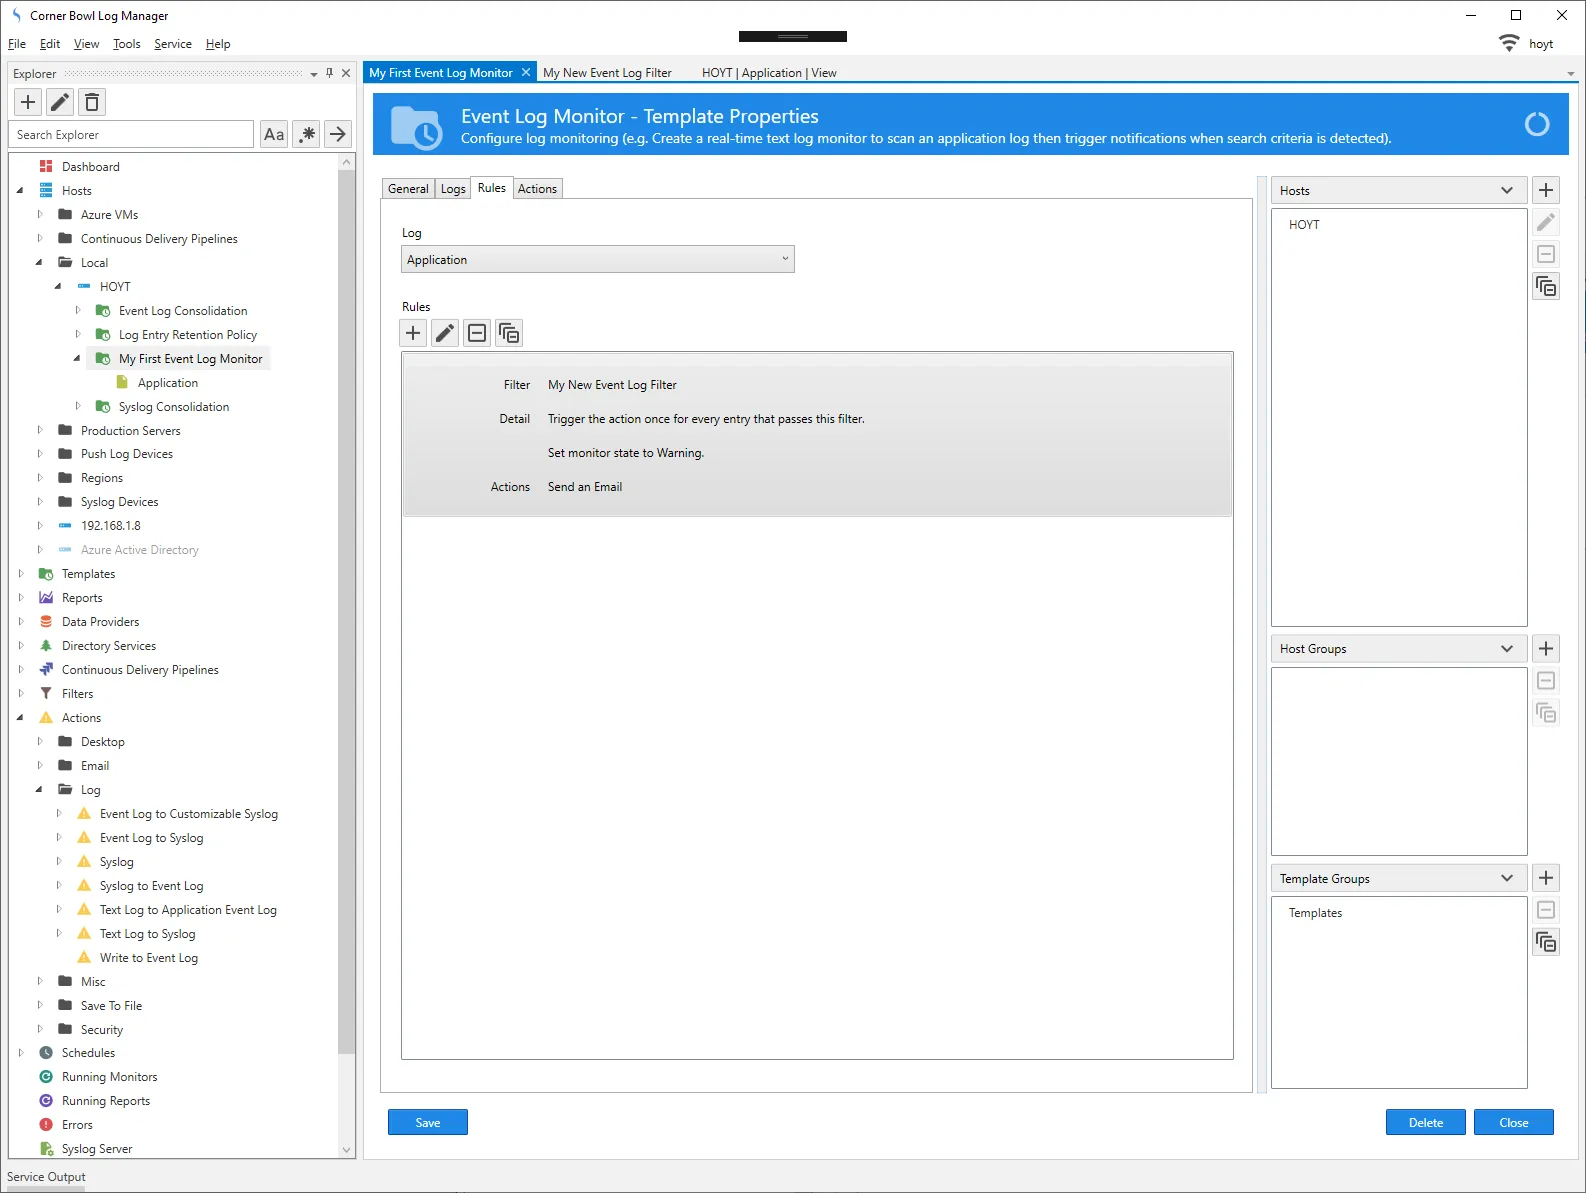
Ok now that we have our filter created lets go back to the template and assign it. Locate the template under the host then right click and select Template Properties. The Template Properties view displays.
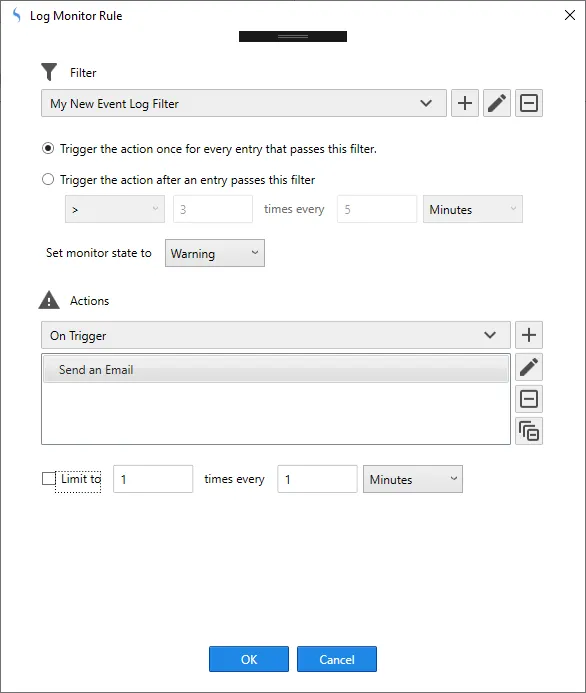
Select the Rules tab then click the Add button. The Log Monitor Rule dialog displays.
Select the new filter from the Filter drop down then assign an Action. Click OK and close the template.
Trigger the event or simulate the log entry then verify your action executes. If not, then from the Explorer view, expand the host, locate and right click on the template, then select Explore. The log monitor status and history view displays. Review the history for errors then resolve.
You have now successfully configured your first Event Log Monitor.
Syslog Monitoring
I am going to assume you already have configured your hardware devices to push syslog messages to the server ELM is installed and the ELM Syslog Server is configured and running.
Just like we did for Event Logs Select File > New, expand Template and select Log Monitor. This time set the Sub Type to Syslog. Specify a name and leave the Schedule set to Real-Time. Use the Hosts drop down to assign the template to each target hardware device. Click Close and save your changes.
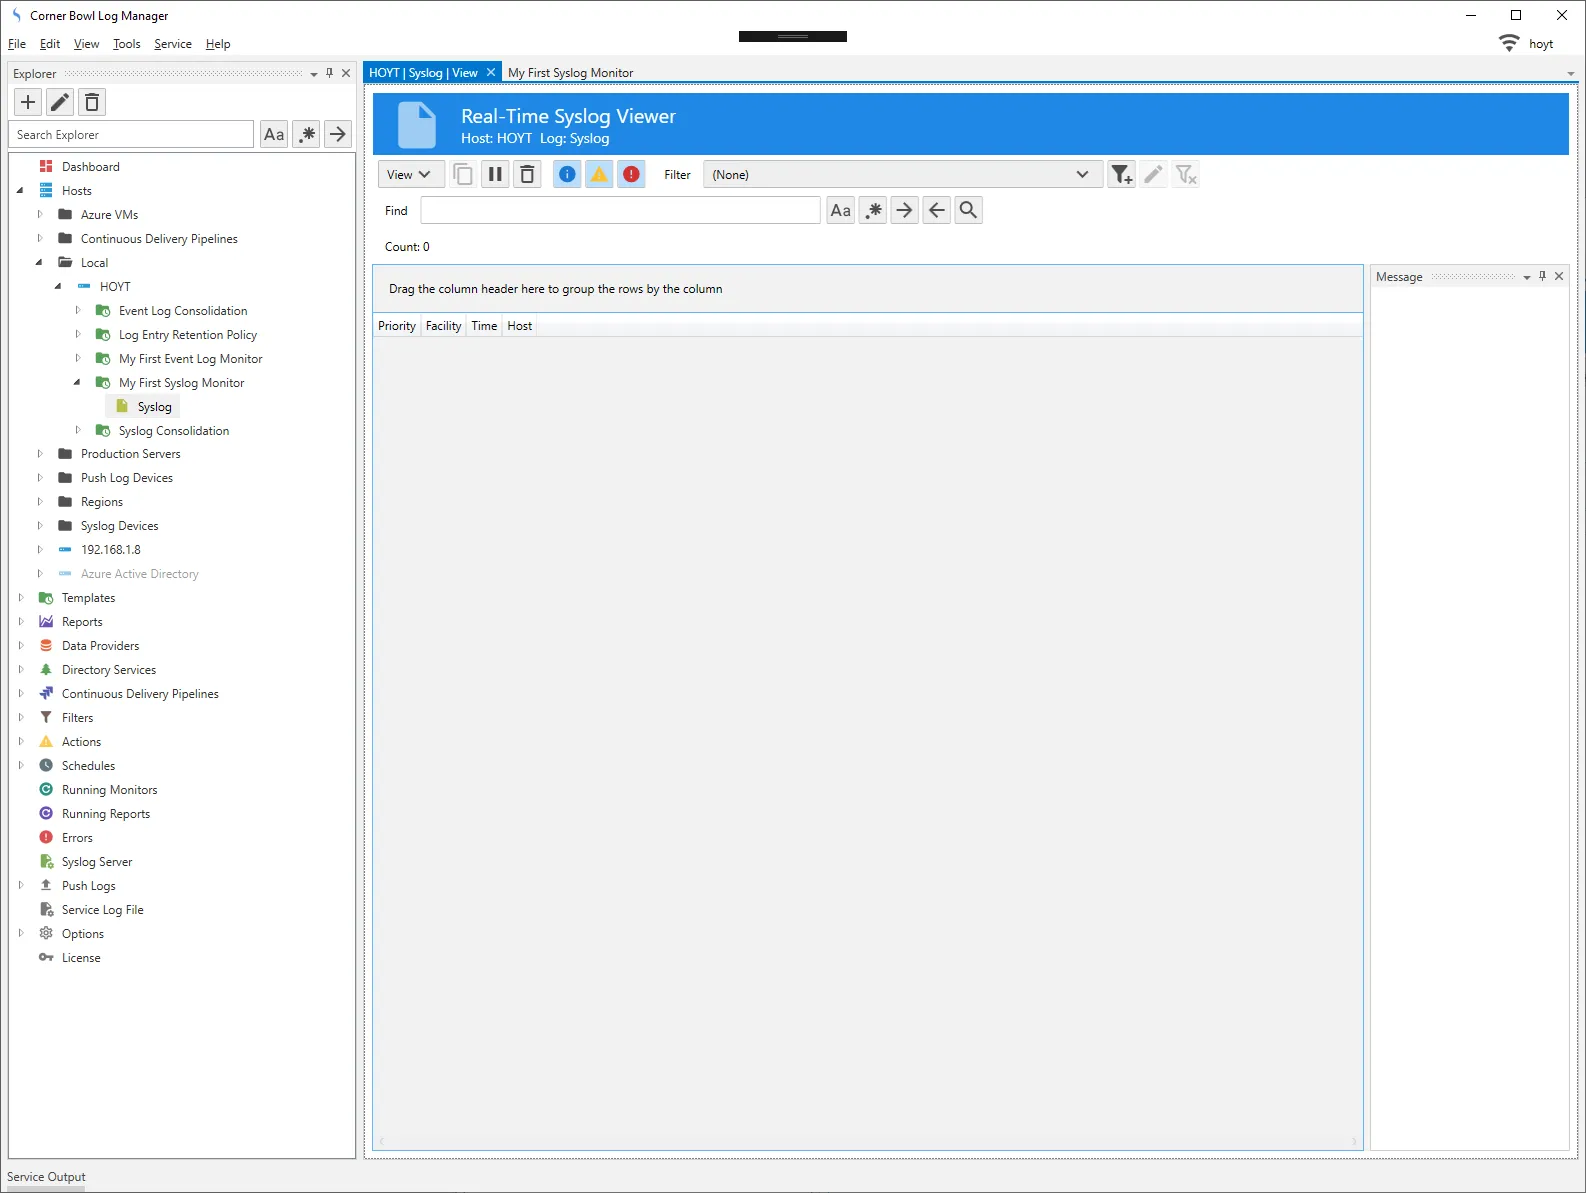
Next we will open the Real-Time Syslog Viewer. From the Explorer view, expand the host, locate and expand the template, then right click on the log listed below and select Watch. The Real-Time Syslog Viewer displays.
Now manually trigger the event of interest so the log entry is generated. If you are unable to manually trigger the event you can modify the Syslog action to simulate the message. Please note this action will only work as desired if you are monitoring syslog messages generated from the server ELM is installed. The pre-installed action is located at: \\Actions\Log\Syslog. Right click on the action and select Properties. Make the necessary changes, click the Save button then the Test button.
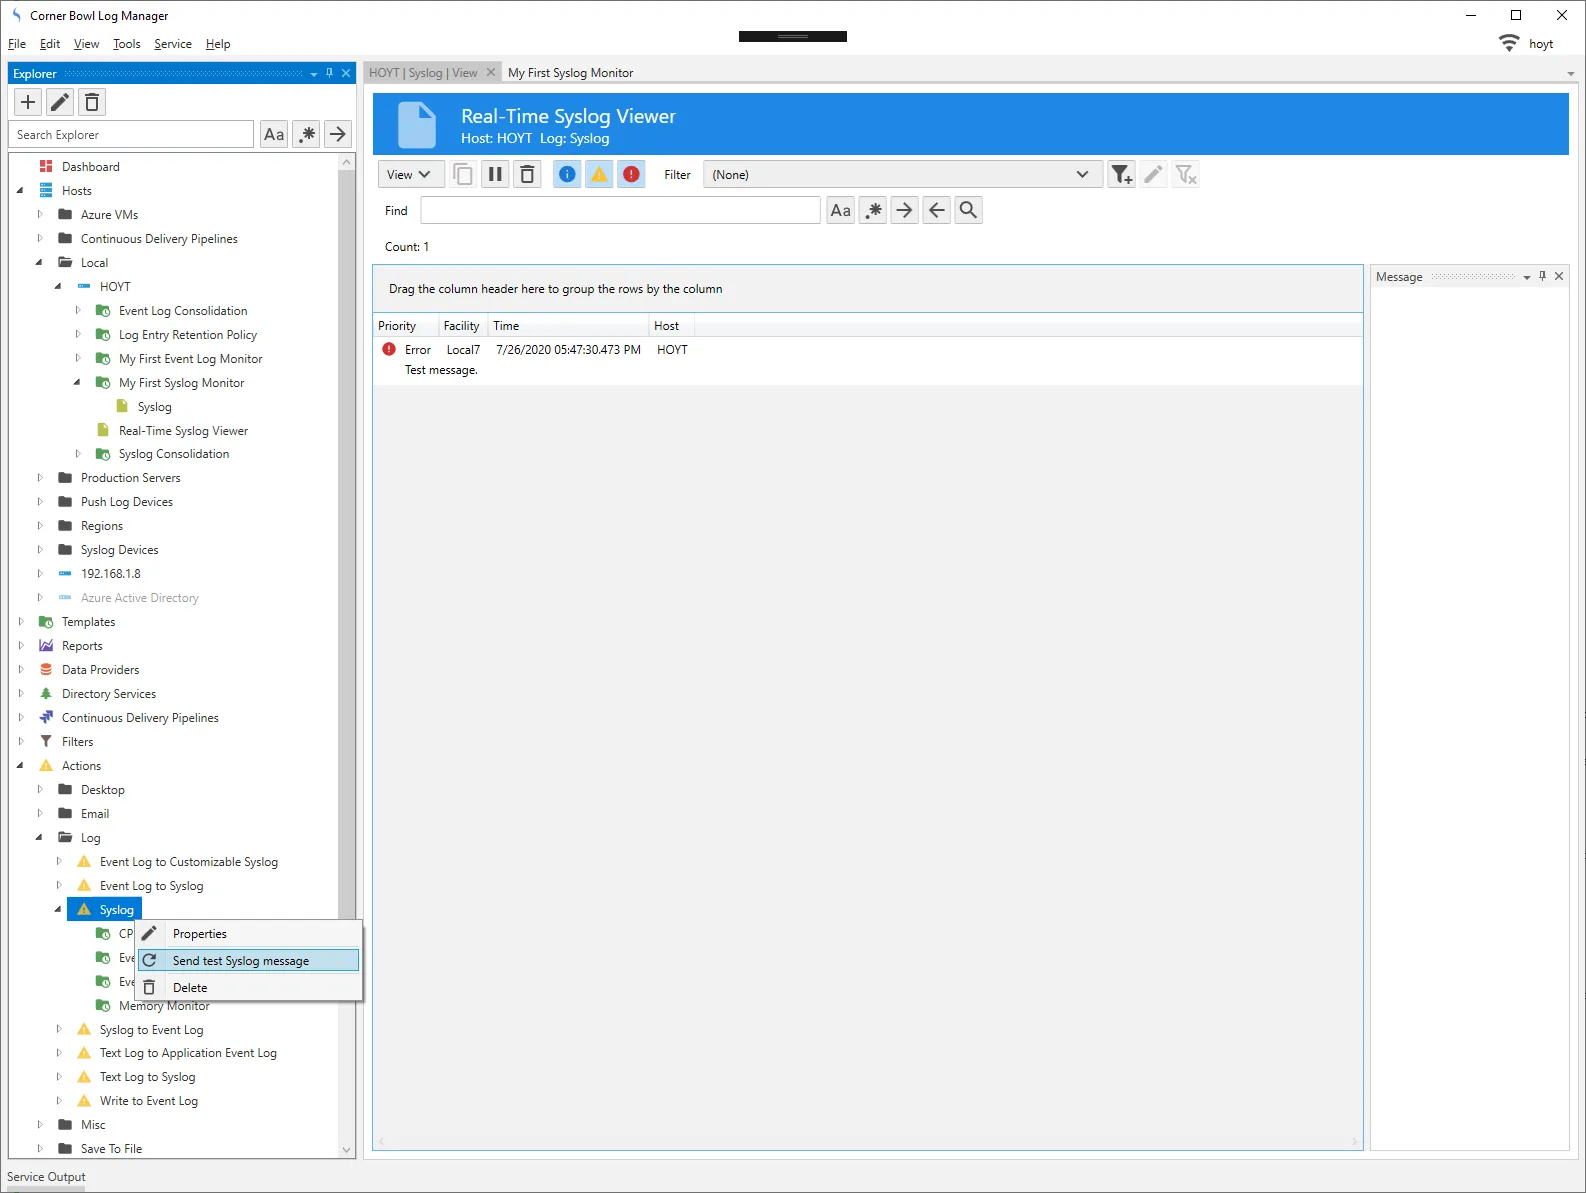
Now back in the viewer we should see the target entry. If the viewer is flowing with new log entries, quickly click the Pause button so the log entry does not scroll off the screen. Right click on the log entry and select Filter Selected Entries. The Filter Selected Entries dialog displays.
Following the steps listed above in the Creating an Event Log Monitor section, to create the filter then define and assign the log monitor rule to the template.
Trigger the event or simulate the log entry then verify your action executes. If not, then from the Explorer view, expand the host, locate and right click on the template, then select Explore. The log monitor status and history view displays. Review the history for errors then resolve.
You have now successfully configured your first Syslog Monitor.
Application Log Monitoring
Now let’s look at text or application log monitoring.
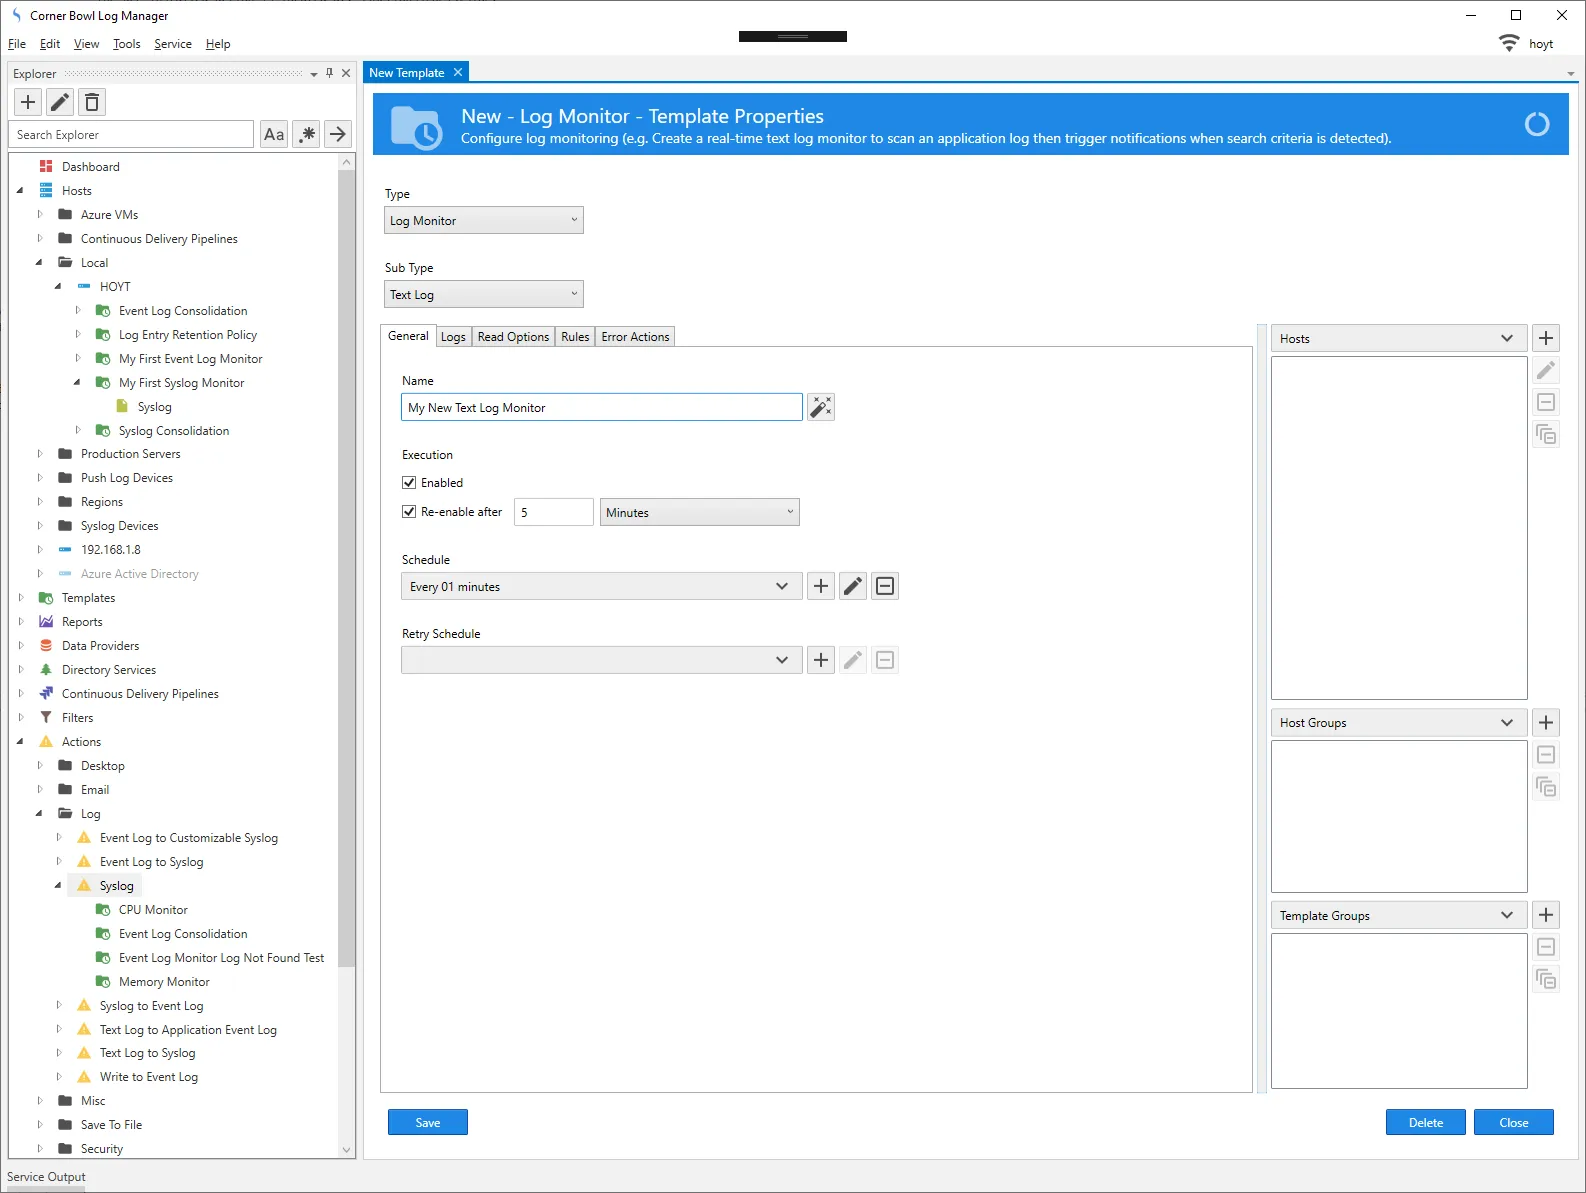
Just like we did for Event Logs and Syslogs select File > New, expand Template and select Log Monitor. This time set the Sub Type to Text Log. Specify a name and set the schedule.
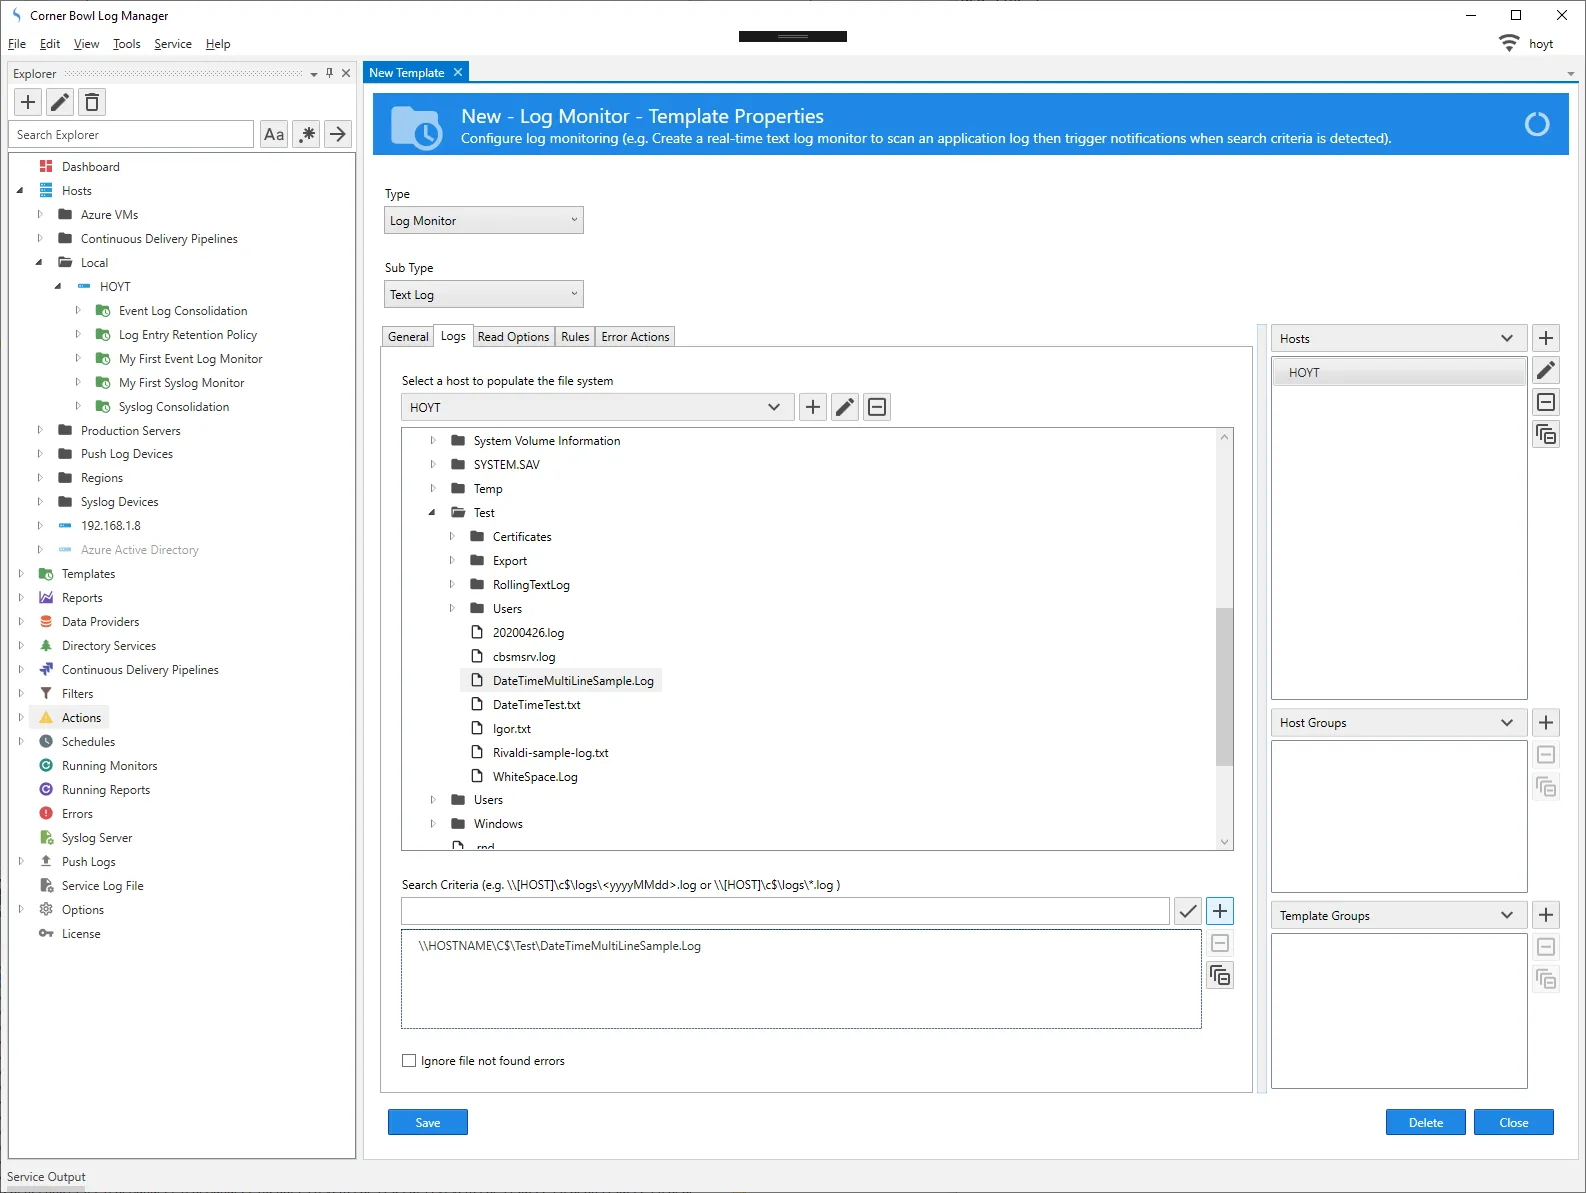
Select the Logs tab then locate the target file.
If the file is a rolling log file that contains the date in the filename, specify the search criteria manually.
Once you have selected the file or specified the search criteria click the Test  button.
If the file or files are detected as expected click the Add
button.
If the file or files are detected as expected click the Add  button.
The host the file resides is be automatically assigned to the template.
button.
The host the file resides is be automatically assigned to the template.
Next, select the Read Options tab. If you specified a file that contains the date within the name, specify a Logical Name so the file displays in the UI and alerts without the date in the name.
If the application log file you want to monitor contains multi-line log entries, specify a the entry pattern. If, for example, each entry starts with a level such as:
<Debug>, <Info>, <Notice>or <Error>
Select Entries start with then specify the following regular expression:
(<Debug>|<Info>|<Notice>|<Error>)
Next, toggle the Use regular expressions  button.

If however your entry starts with a date and time, select Entry starts with date and time then specify the format. If, for example, each entry starts with:
07/26/2020-08:30:00.000
Specify the following expression:
MM/dd/yyyy-HH:mm:ss
Notice I left off the milliseconds for simplicity. You can even leave off the time if you are certain entries will not contain the date in the same format at the start of a new line within a log entry.
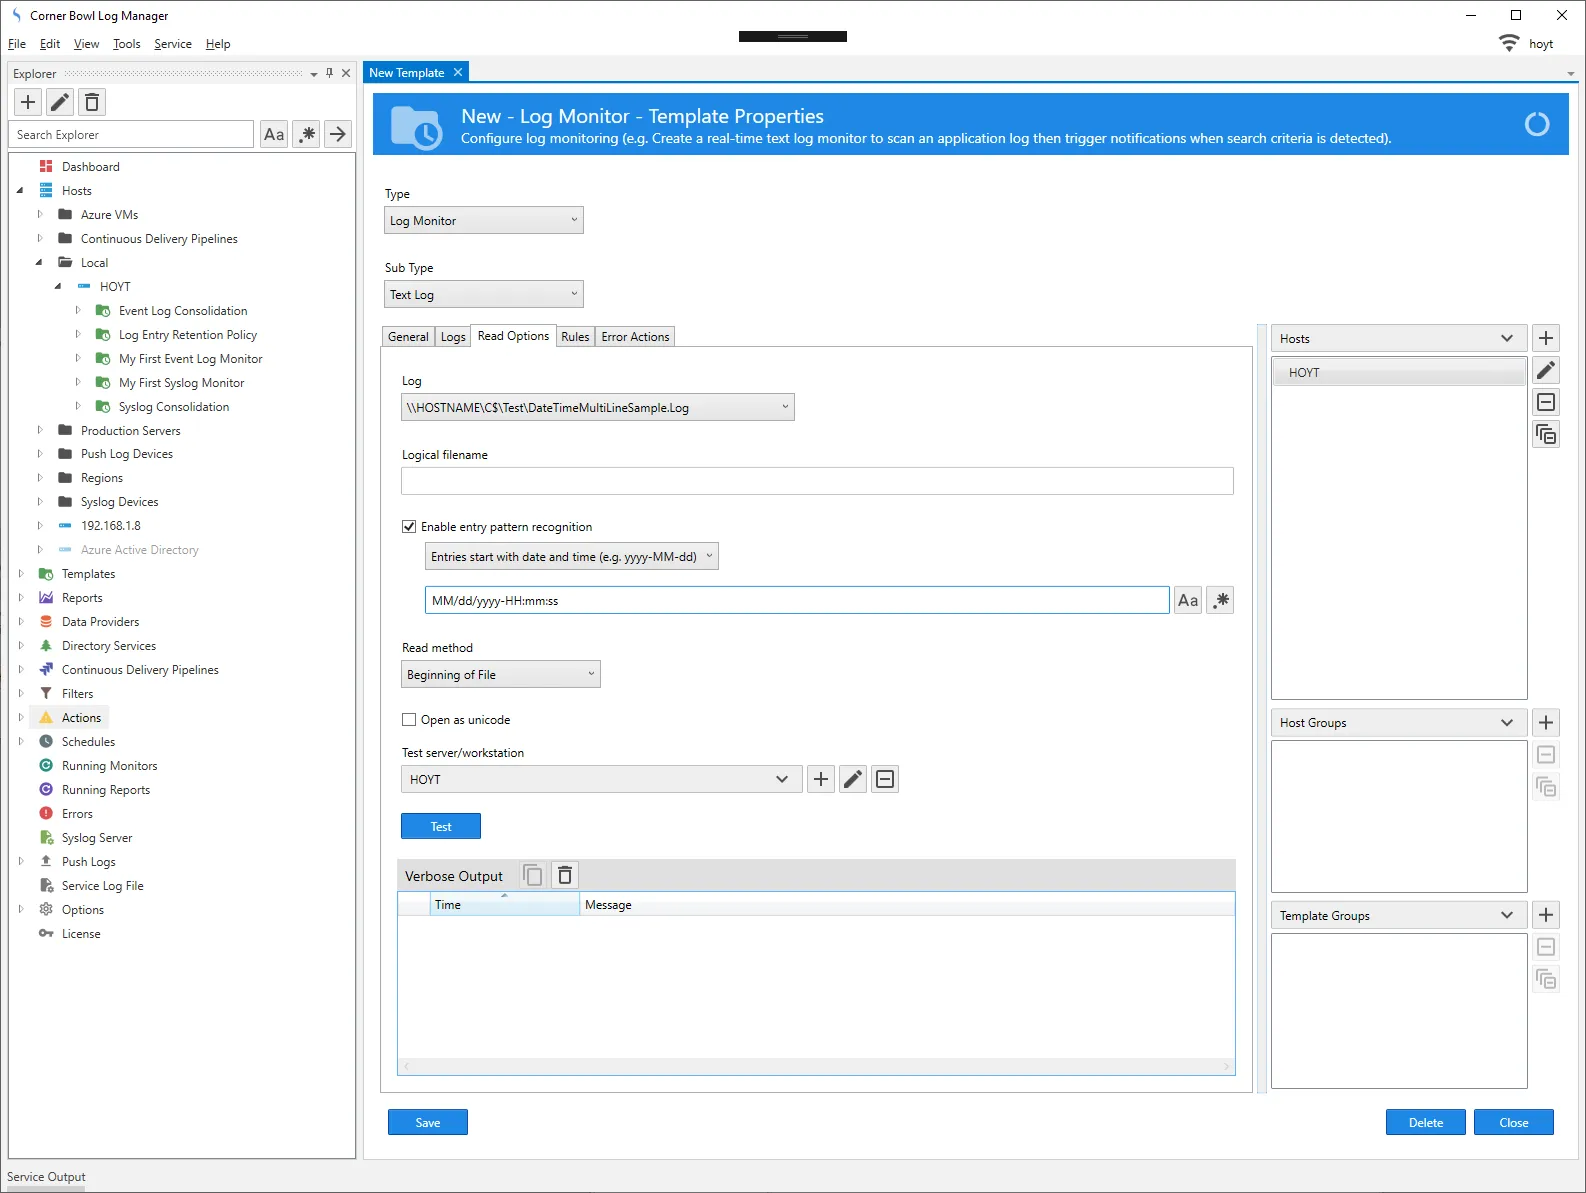
Select the read method. If the file already exists and you only want to receive alerts for this point forward, select End of File. If you would like to receive alerts for the entire file select Beginning of File and finally if you would like to scan the entire file each time the monitor runs select Read All.
Following the steps listed above in the Creating an Event Log Monitor section, to create the filter then define and assign the log monitor rule to the template.
Trigger the event or simulate the log entry then verify your action executes. If not, then from the Explorer view, expand the host, locate and right click on the template, then select Explore. The log monitor status and history view displays. Review the history for errors then resolve.
You have now successfully configured your first Text or Application Log Monitor.
Last Updated: March, 3rd 2024