Simple SIEM Reports with Server Manager
October 12th, 2021
In this article I am going to show you how to search your centralized data repository for user activity across multiple hosts, devices and network applications with Server Manager's Simple SIEM Report.
Prerequisites
- The software must already be downloading and saving logs from multiple sources.
- The Data Repository must configured to use either SQL Server, MySQL or File System.
How To
In my sample today I am going to scan logs from two Windows Workstations, a Windows Server, an Azure Active Directory Audit Log, several Syslogs and Corner Bowl Server Manager's own text-based application log file. Ok let's get started.
- First, I'm going to open the Management Console and connect to the service using my Windows credentials.
-
I like to manage hosts in groups so I am going to create a new group that
contains all of the hosts I want to include in the report. Using drag and drop I
drag each server to the group I want to reference then select the Link
option. The link option enable you to assign a host to multiple groups where as
the move option moves the host to the target group.
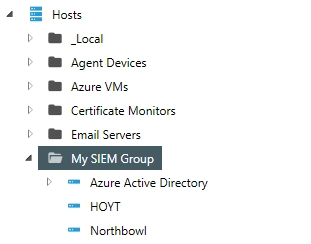 Simple SIEM Report Host Group
 - Next, from the menu bar select File | New | Report, The New Report View displays.
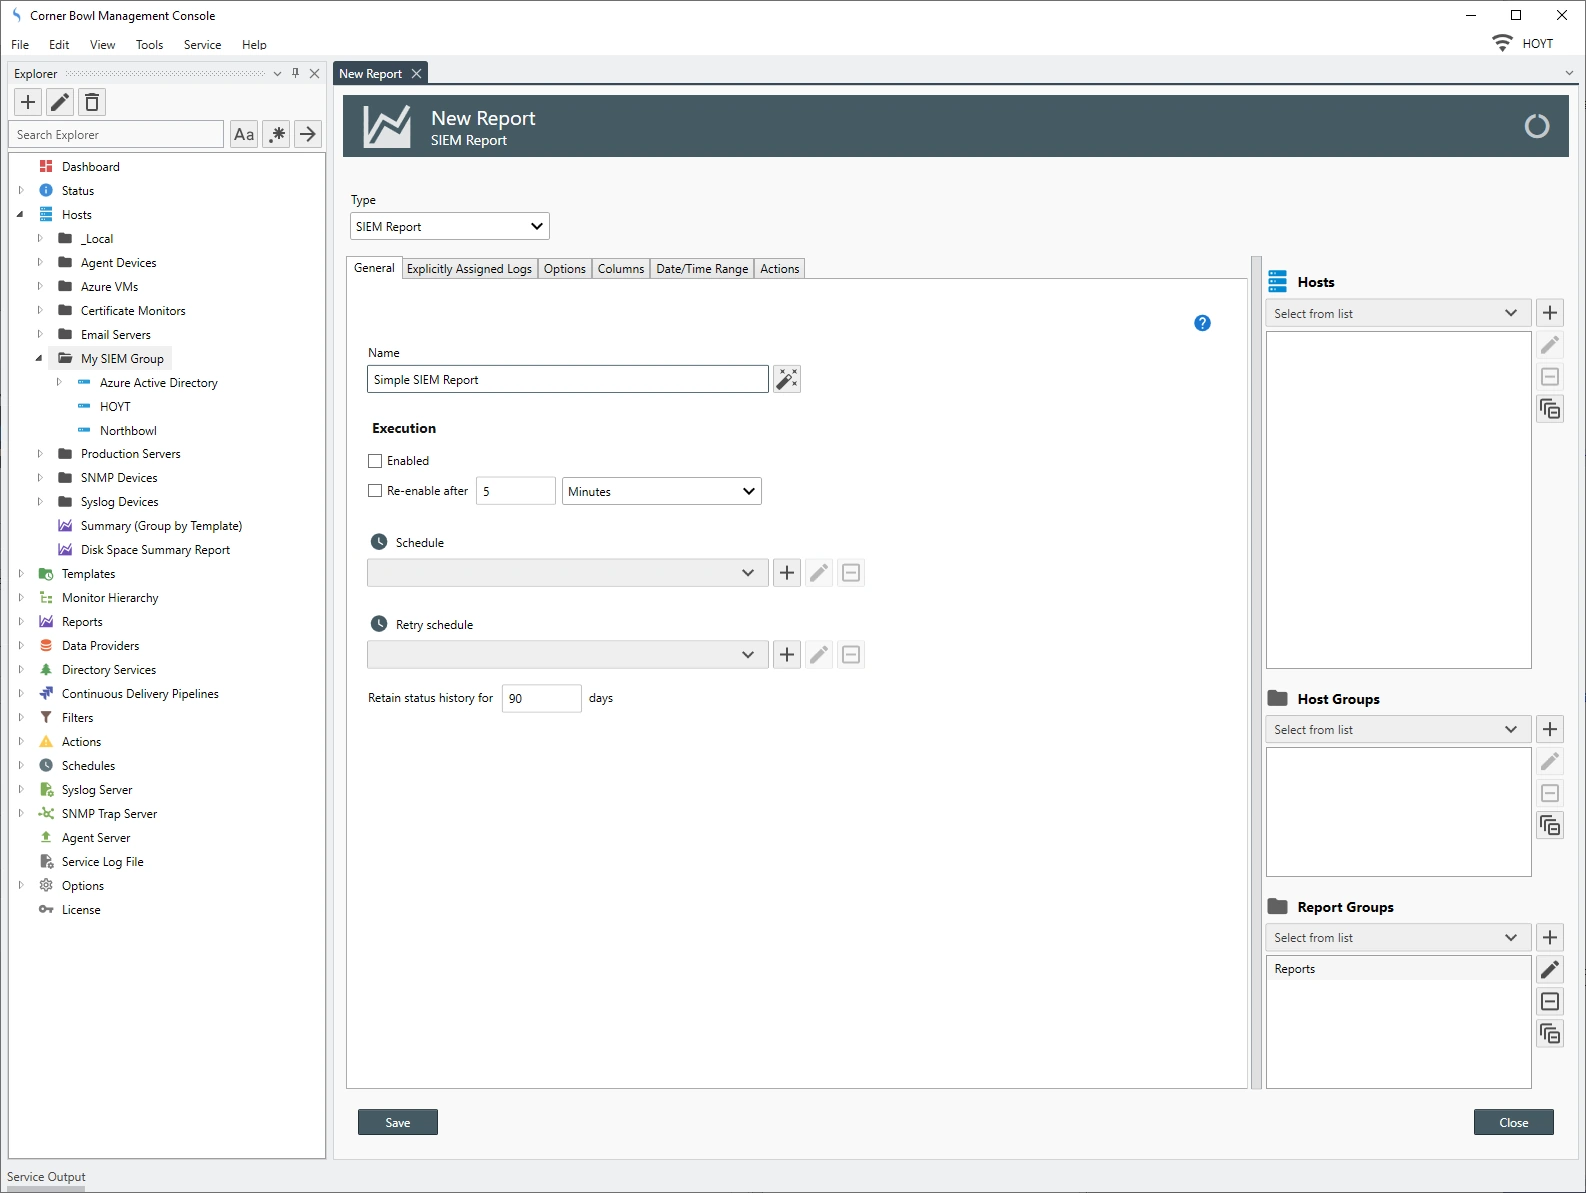
- Under the Type drop-down select SIEM Report.
-
If you would like to schedule the report specify a schedule otherwise de-select
the Enabled option meaning the report is not scheduled for execution.
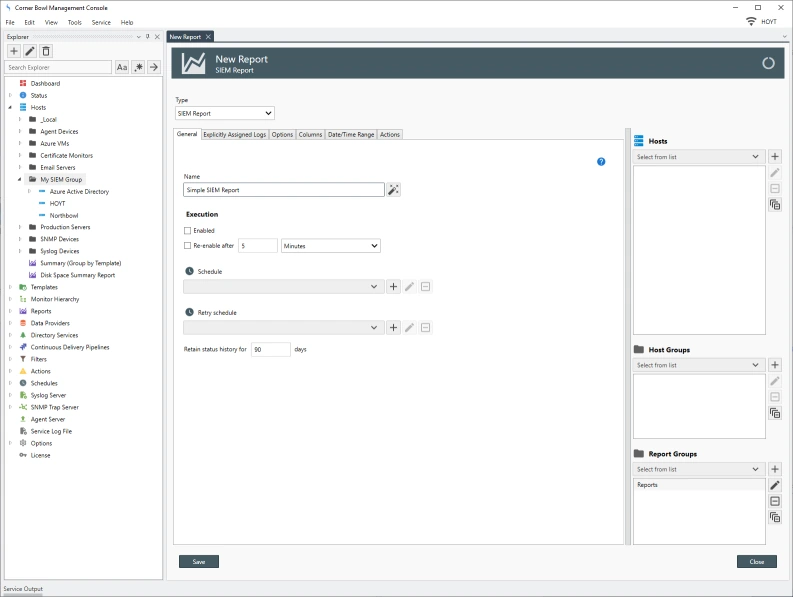 Simple SIEM Report general properties
 - The Explicitly Assigned Logs tab enables you to assign archived and auxiliary consolidated logs to the report. Auxiliary consolidated logs are logs that have been loaded from a database backup or other installation. For this tutorial I am only interested in scanning the primary log repository. So I am going to leave this view blank.
-
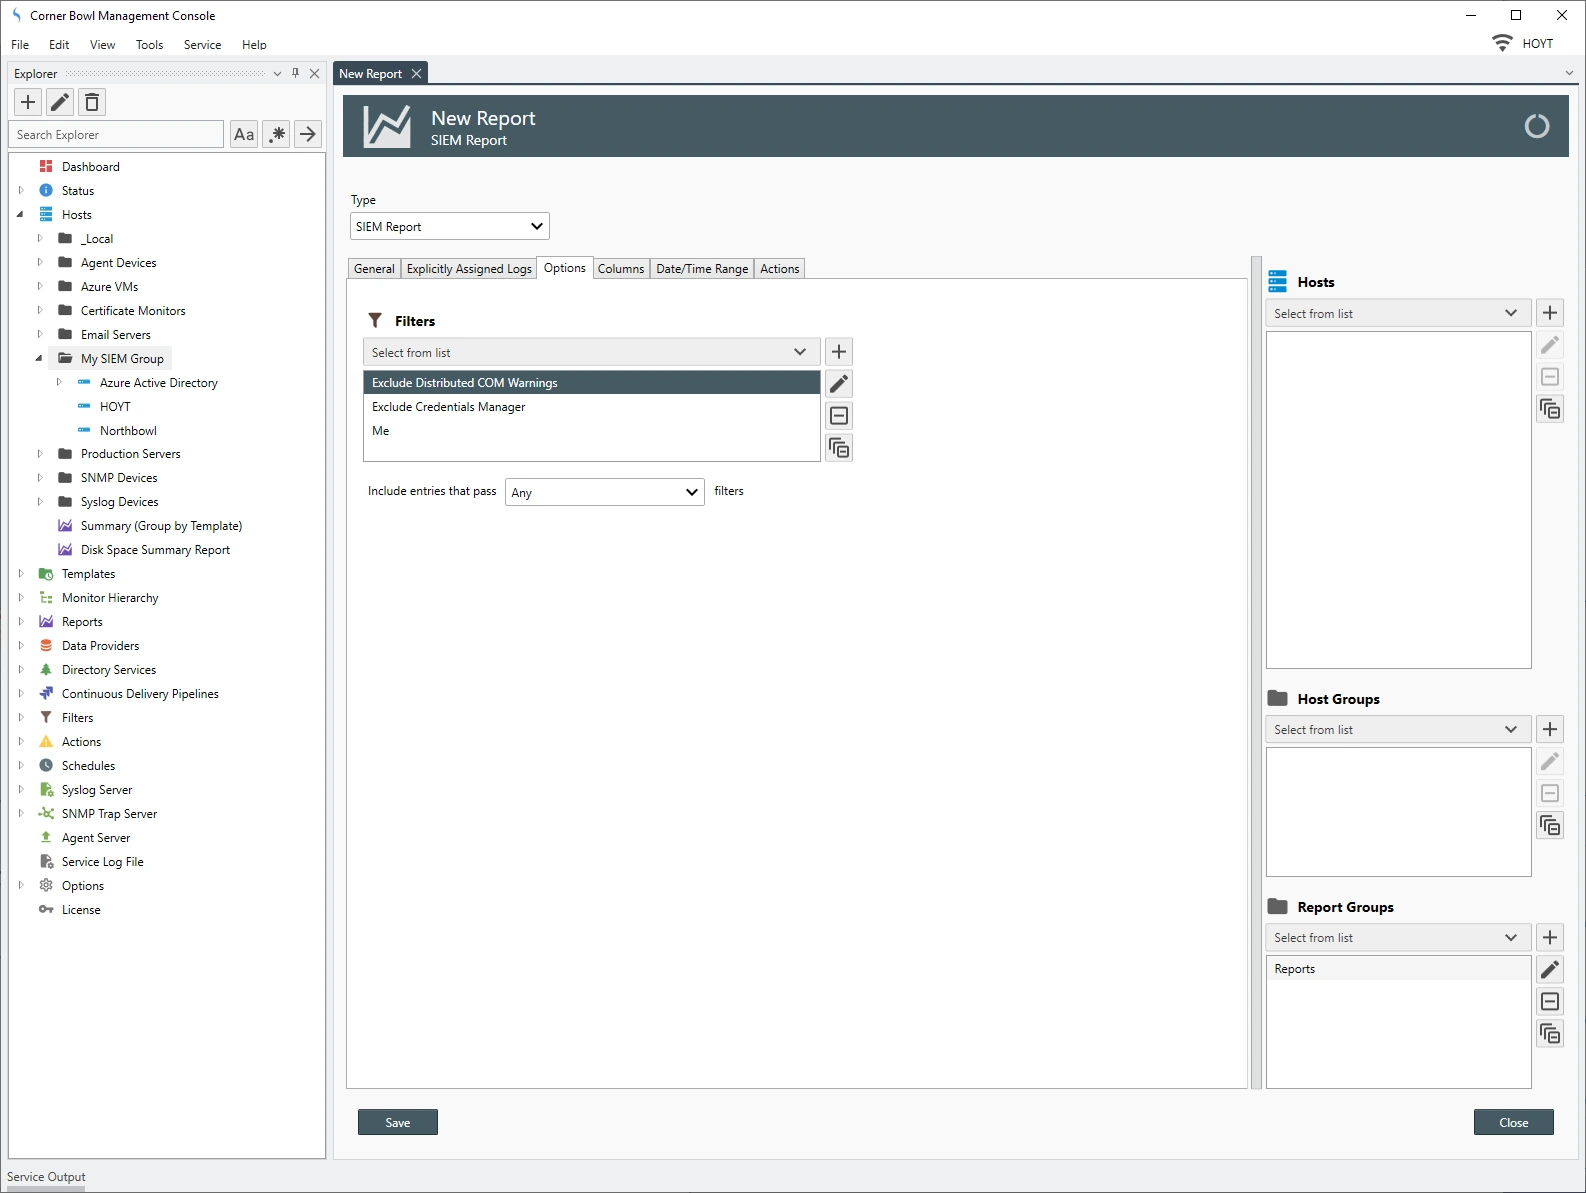
The Options tab enables you to assign a filter to target specific entries. I
already created a filter called 'Me which if we take a look at it is a Simple
Text Log Filter that looks for two of my login account names. When you assign a
Text Log Filter to a SIEM Report, the filter will be applied to all fields in
all log entries. When you assign filters of a specific type, such as an Event
Log Filter, the filter is only applied to log entries of the target type. I
previously created some Event Log Filters to filter out several Event ID types.
If I apply those Event Log filters, the target entries will be filtered out of
the report. If we look at the Exclude Distributed COM Warnings filter we can see
the IsNot flag is set meaning show everything but entries 10016 and 10028.
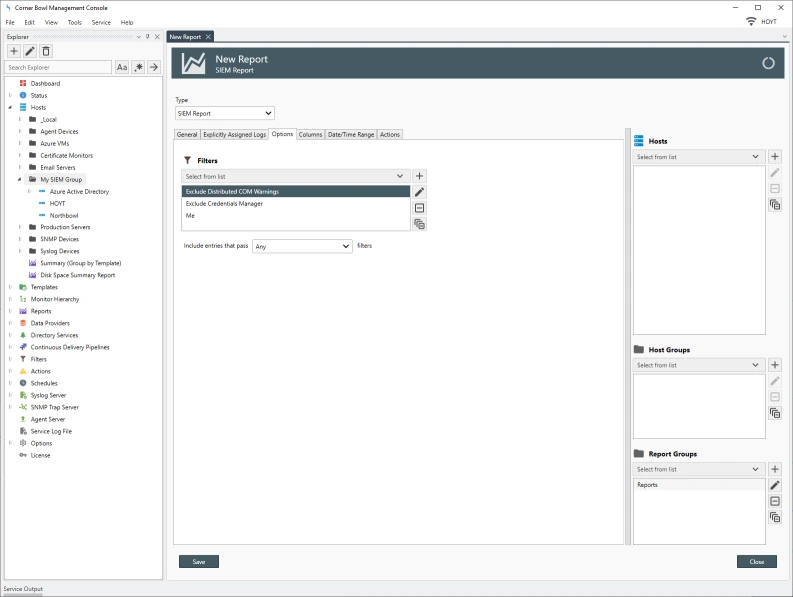 Simple SIEM Report filter properties
 -
The Columns tab enables your to select the columns you want to include, the
soft order and optionally the column to group by. By default the report sorts by
time descending with no grouping.
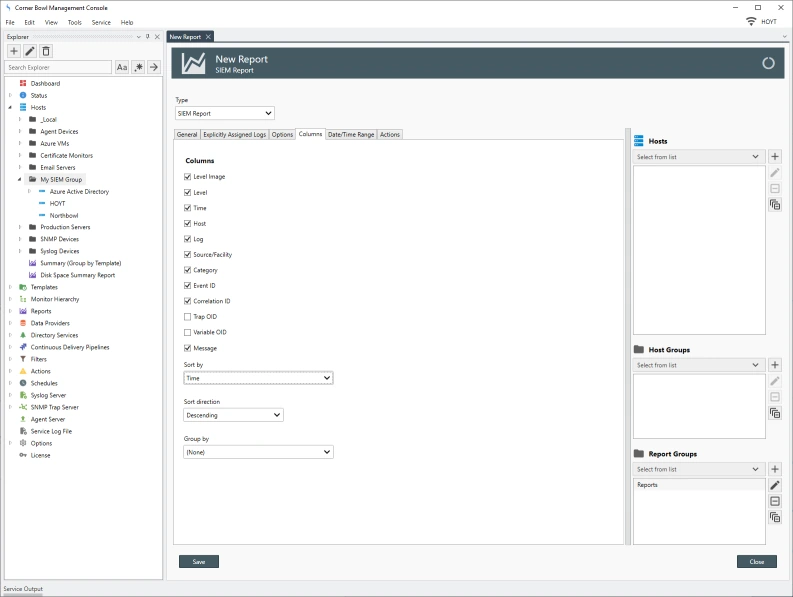 Simple SIEM Report column properties
 - The Date/Time Range tab enables you to select the date range you want to search. I am going to select the last 12 hours. If you select a large date range or are viewing Domain Controller Security Event Logs the report may return too much data to efficiently view. Be sure to limit the expected results so the report is performant.
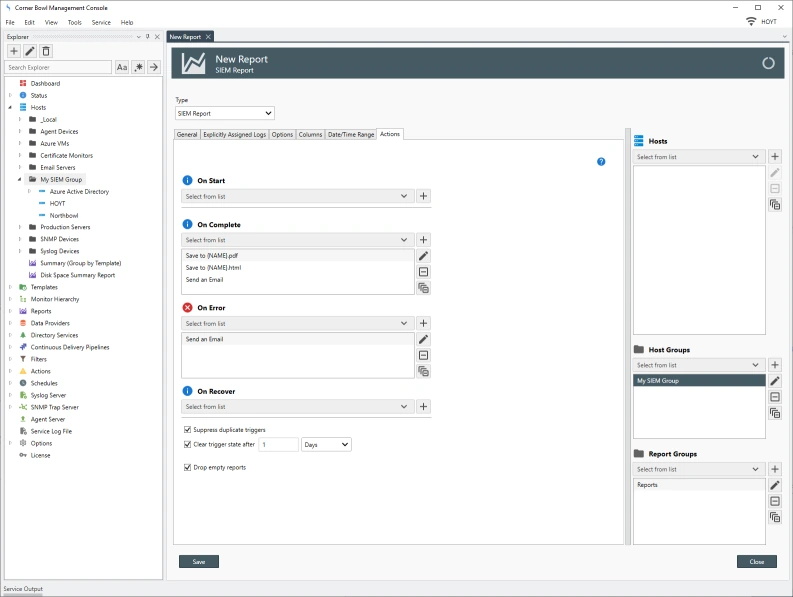
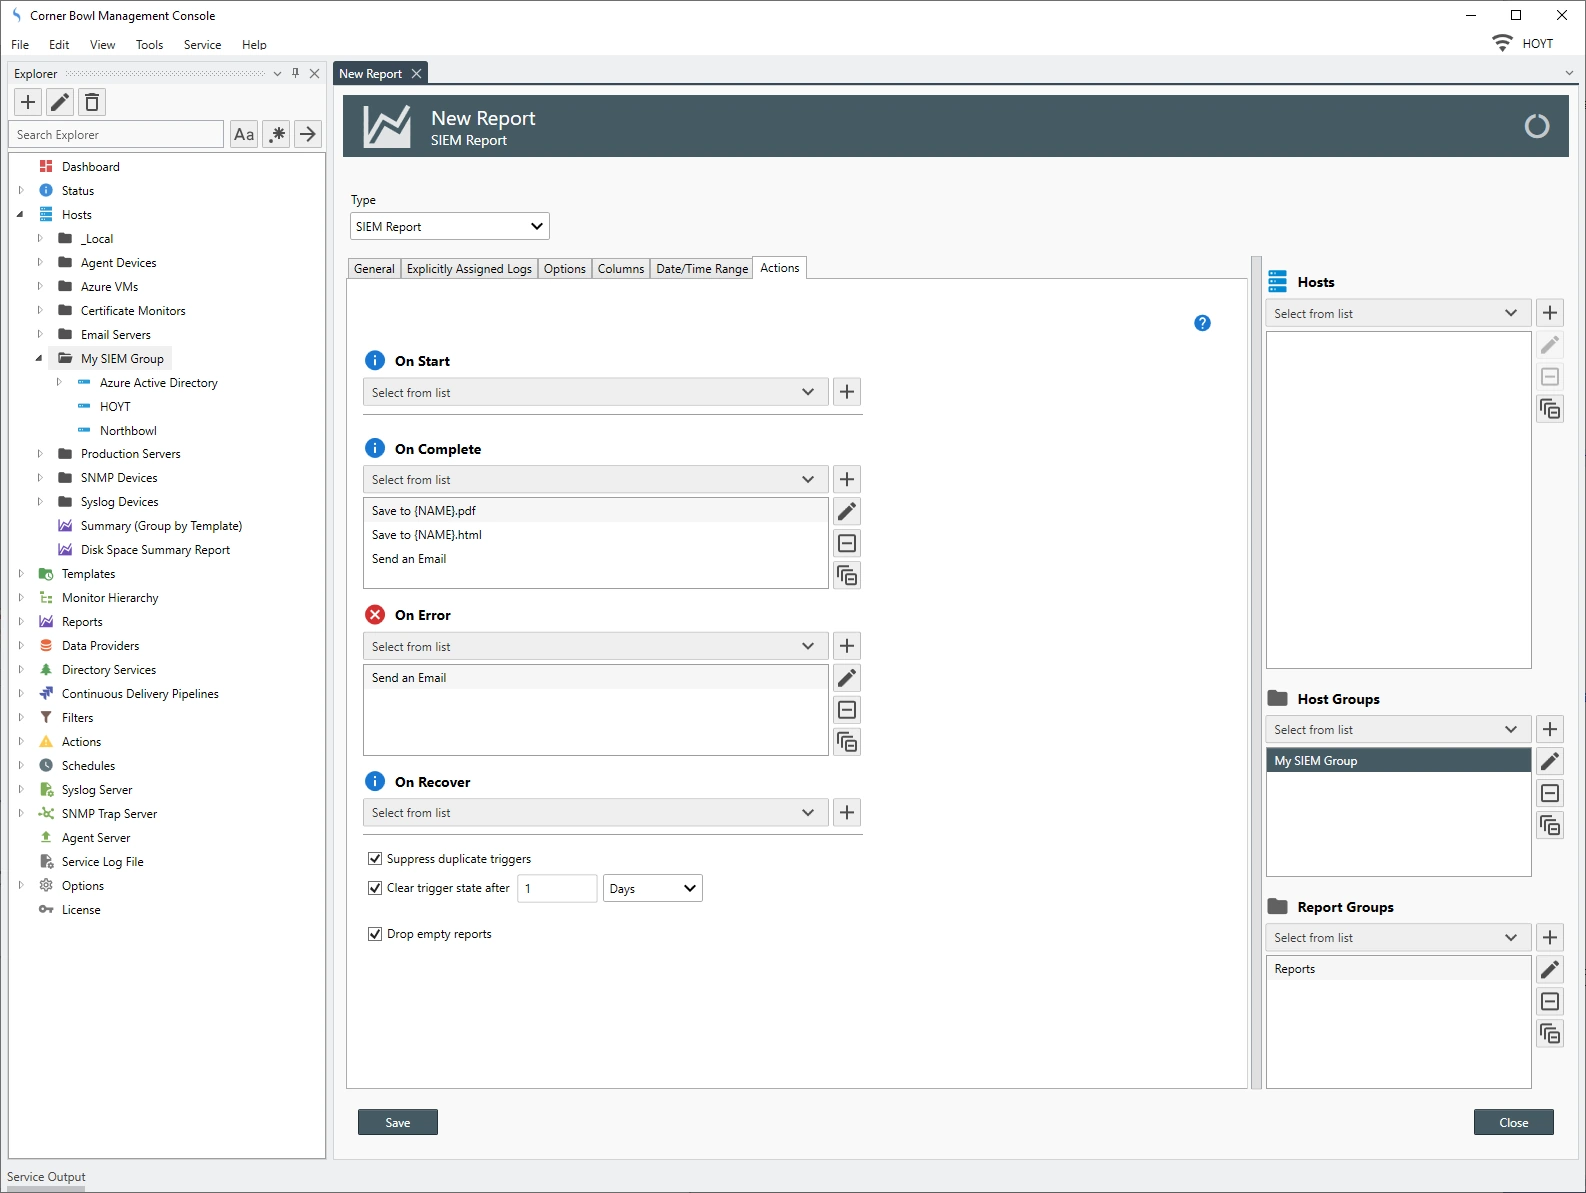
- Finally, if you schedule this report the Actions tab enabled you to assign email and file output actions.
-
Remember earlier I create a group and assigned all the hosts to the group I
want to scan. On the right side we can now assign that group to this report. If
at a later time you add a host to a group that is assigned to this report or any
report that host will be automatically included in the report.
 Simple SIEM Report host assignment
 -
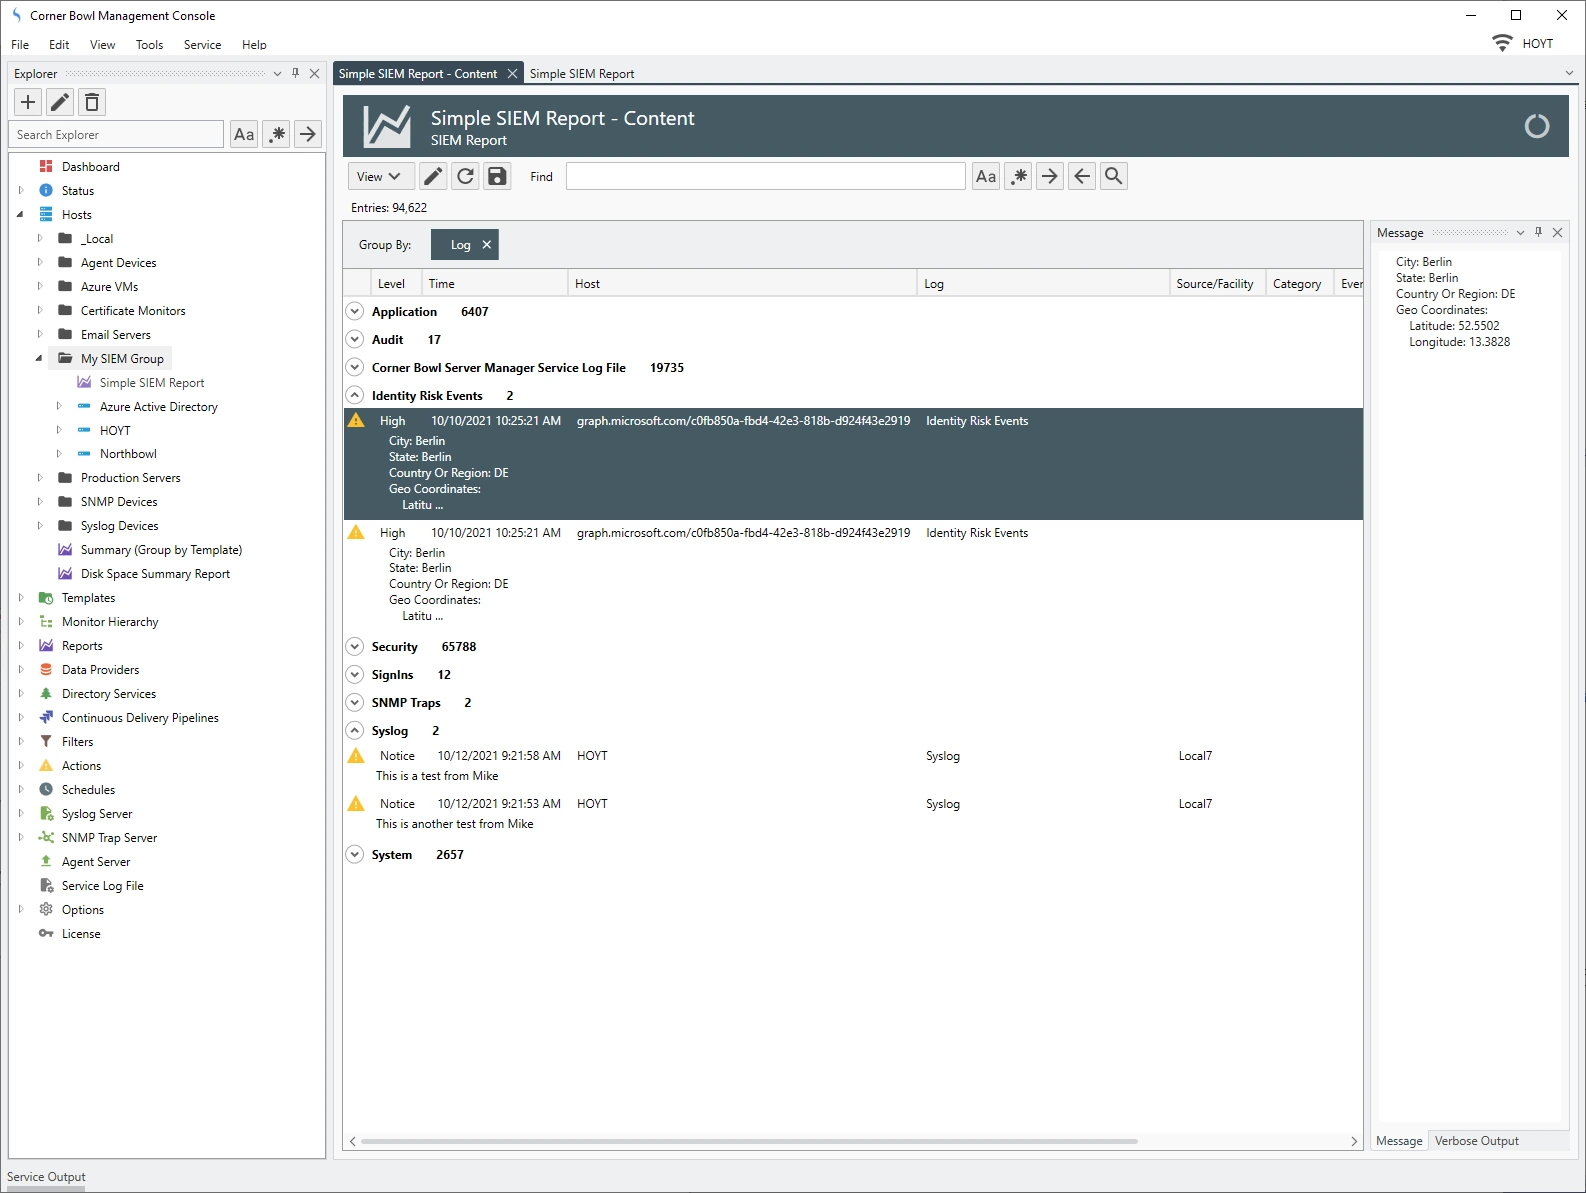
Now if I save the report then click View Report, we can see the results.
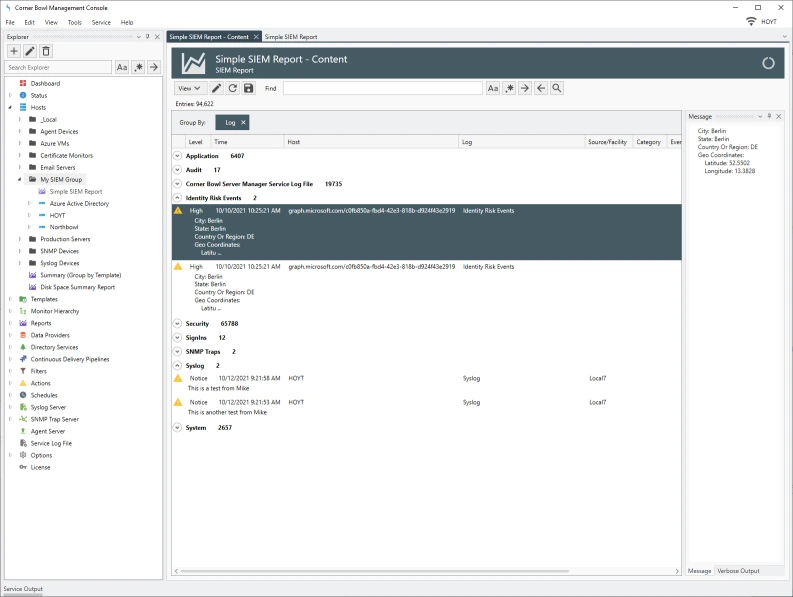 Simple SIEM Report viewer
 - The viewer has a few options worth mentioning, Message View, shows or hides the Message View and Preview Message, which shows or hides the preview message much like the Outlook email message preview many of us are used to seeing.
- Notice the viewer contains a column called Source/Facility. This column holds both Event Log Source values and Syslog Facility values. Since these fields are in essence the same but for different log types, there is no overlap, and the columns can be combined into one.
- The Correlation ID is used by Azure Active Directory Audit Logs. Notice also the Azure Entra ID Audit Log message contains all of the values returned from the Azure Active Directory Audit Log in JSON format.
- If I drag and drop the Host to the Group By header we can see the various hosts (not shown).
- If I drag and drop the Log to the Group By header we can see the various logs (not shown).
-
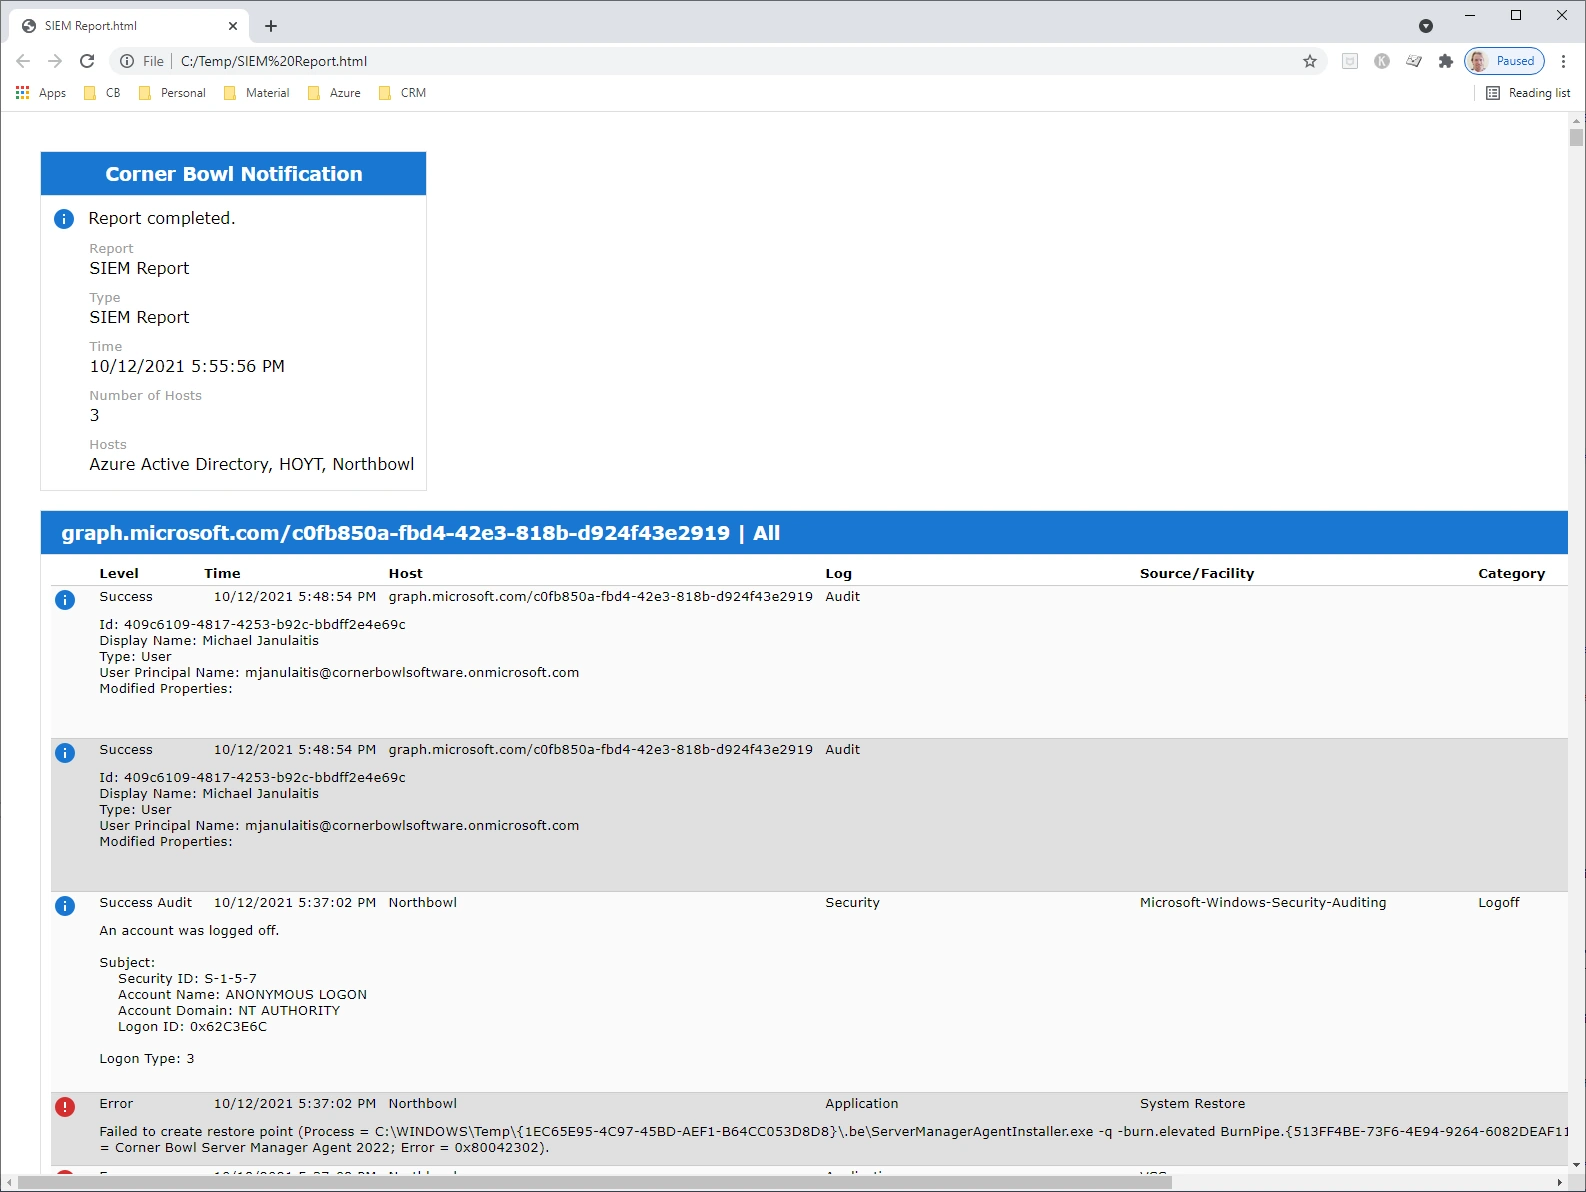
You also have the option of exporting the report to HTML. Simply click the
Save button, specify a filename and path then click Save. The
Save As dialog displays asking you if you would like to overwrite
existing files or backup previous files and optionally open the output file when
complete. Once I click Ok we can see the output report.
 Simple SIEM HTML Report

That's SIEM reporting with Corner Bowl Server Manager.
October 12th, 2021