Syslog Consolidation with Event Log Manager 2026
May 5th, 2021
In this article I am going to show you how to centralize, consolidate and view Syslog entries with Event Log Manager 2026.
Table of Contents
How to Configure the Windows Syslog Server
The first thing we need to do is make sure our syslog server is running.
-
From the Explorer View, locate the Syslog Server item, then right click and select Properties.
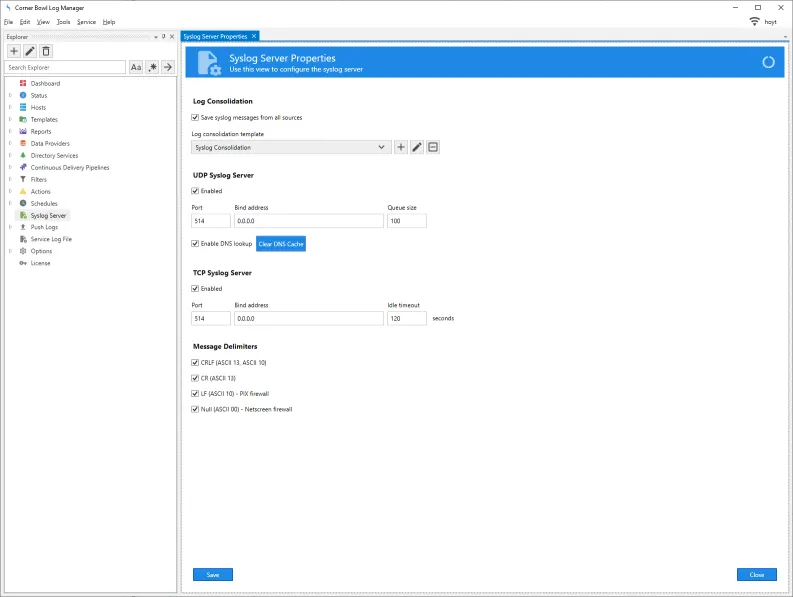 By default, Save syslog messages from all sources is selected and the default Syslog Consolidation template applied. When this option is set any device that sends a syslog message is automatically added to the system and entries saved to the log repository database. Otherwise you can select to manually assign the consolidation template to specific devices you add to the system. In that case messages received from devices that have not been configured are dropped.
 - If I click on the Edit
 button we can view default Syslog Consolidation template properties.
 -
The General tab enables you to specify a name and schedule.
If you have maintenance periods you would like to define modify the Real-Time schedule or create a new real-time schedule to include your maintenance periods.
-
The Options tab enables you to specify a consolidation filter enabling you to limit the entries saved to the log repository (e.g. Only save warning and higher syslog entries).
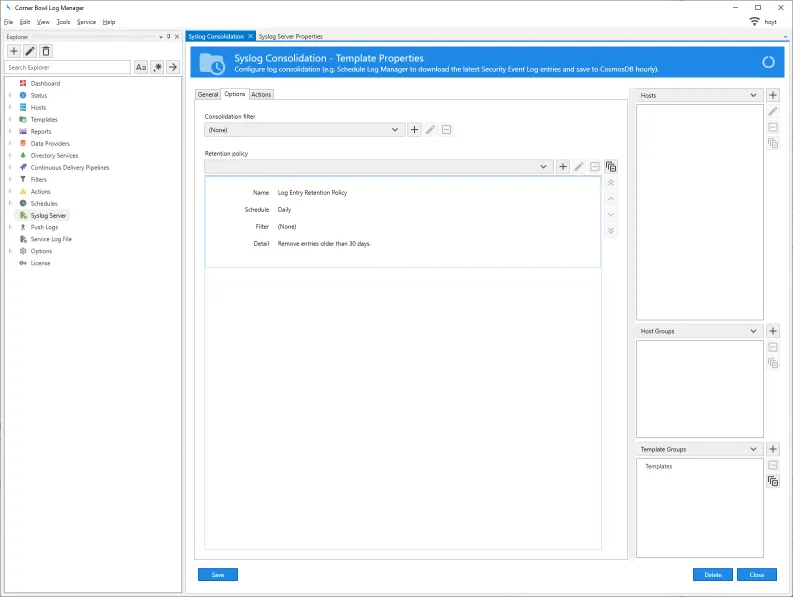
- The Retention policy enables you to define how long to retain syslog entries (e.g. Remove information messages after 30 days). Log Manager enables you to specify multiple policies (e.g. A second policy could be added to remove all messages after 90 days).
- If I double click on the assigned policy, we can see the schedule is set to run once a day.
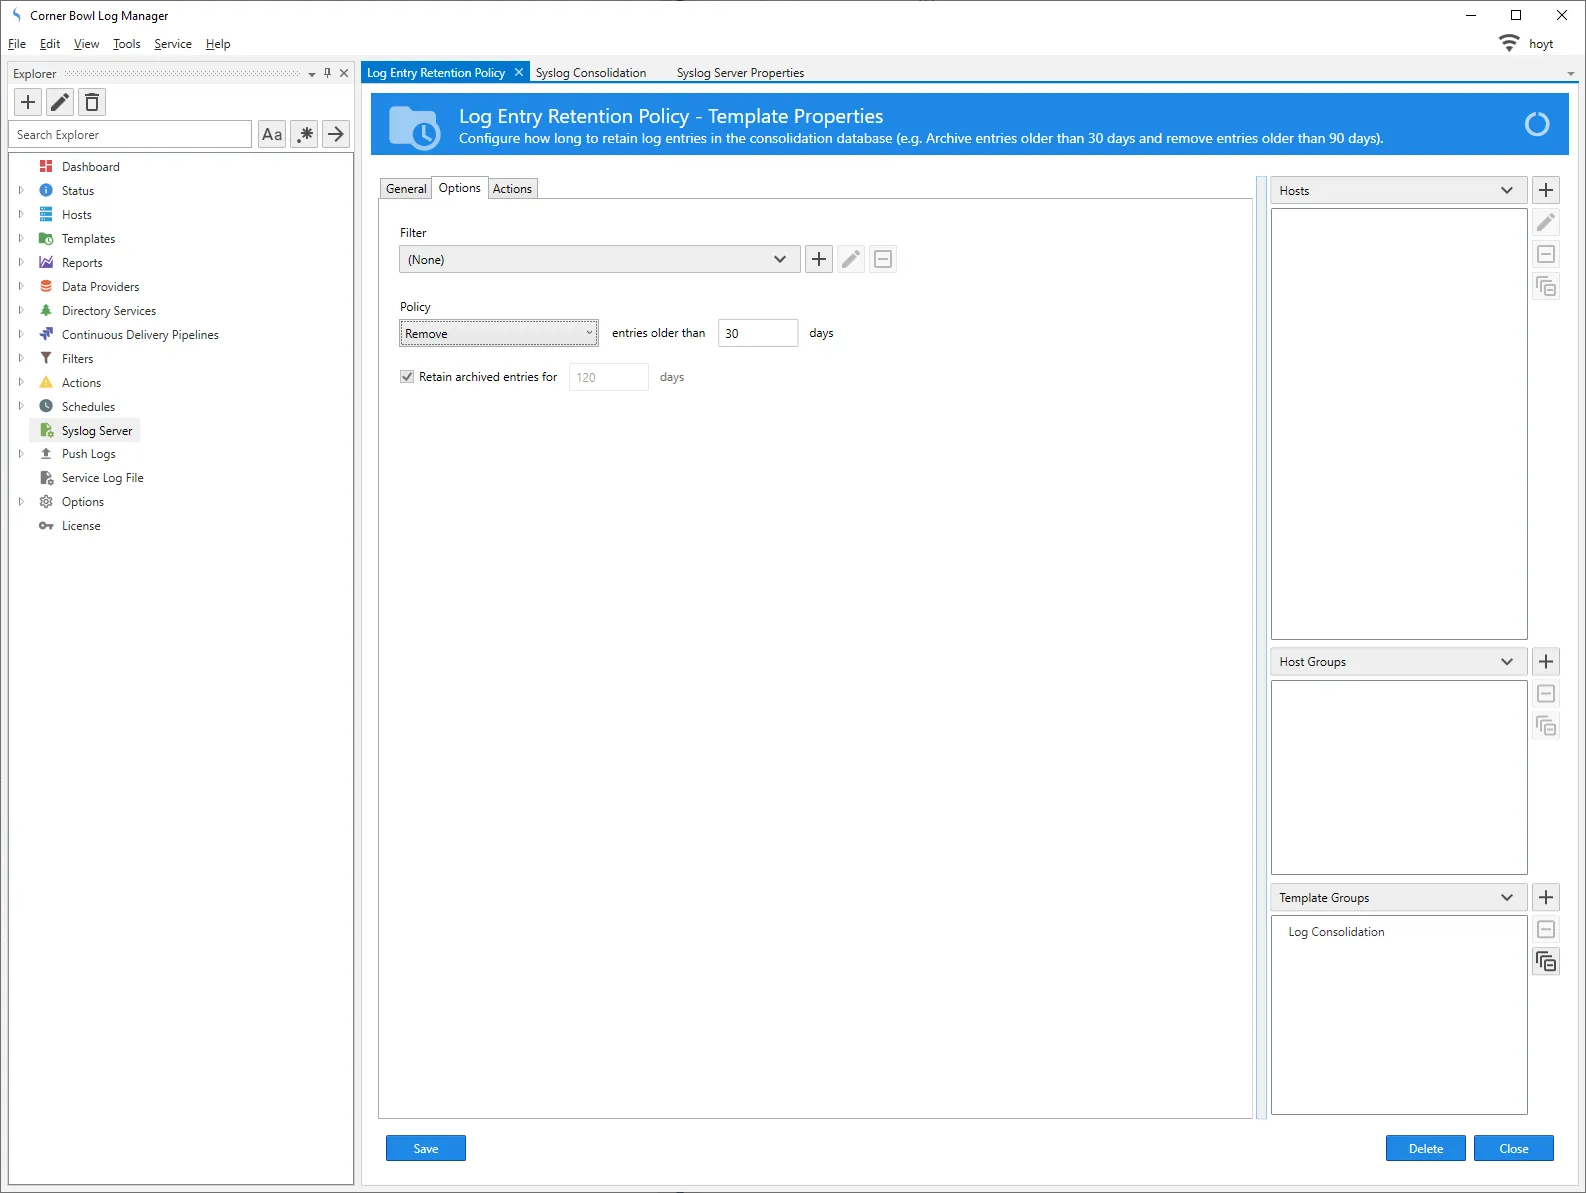
- The Options tab enables you to specify a filter to apply (e.g. Remove all information messages).
-
Finally, you can specify the policy. You have the option of removing entries after a set number of days or you can archive entries off to another database freeing up the primary log repository for faster reporting while continuing to comply with your audit policy requirements.

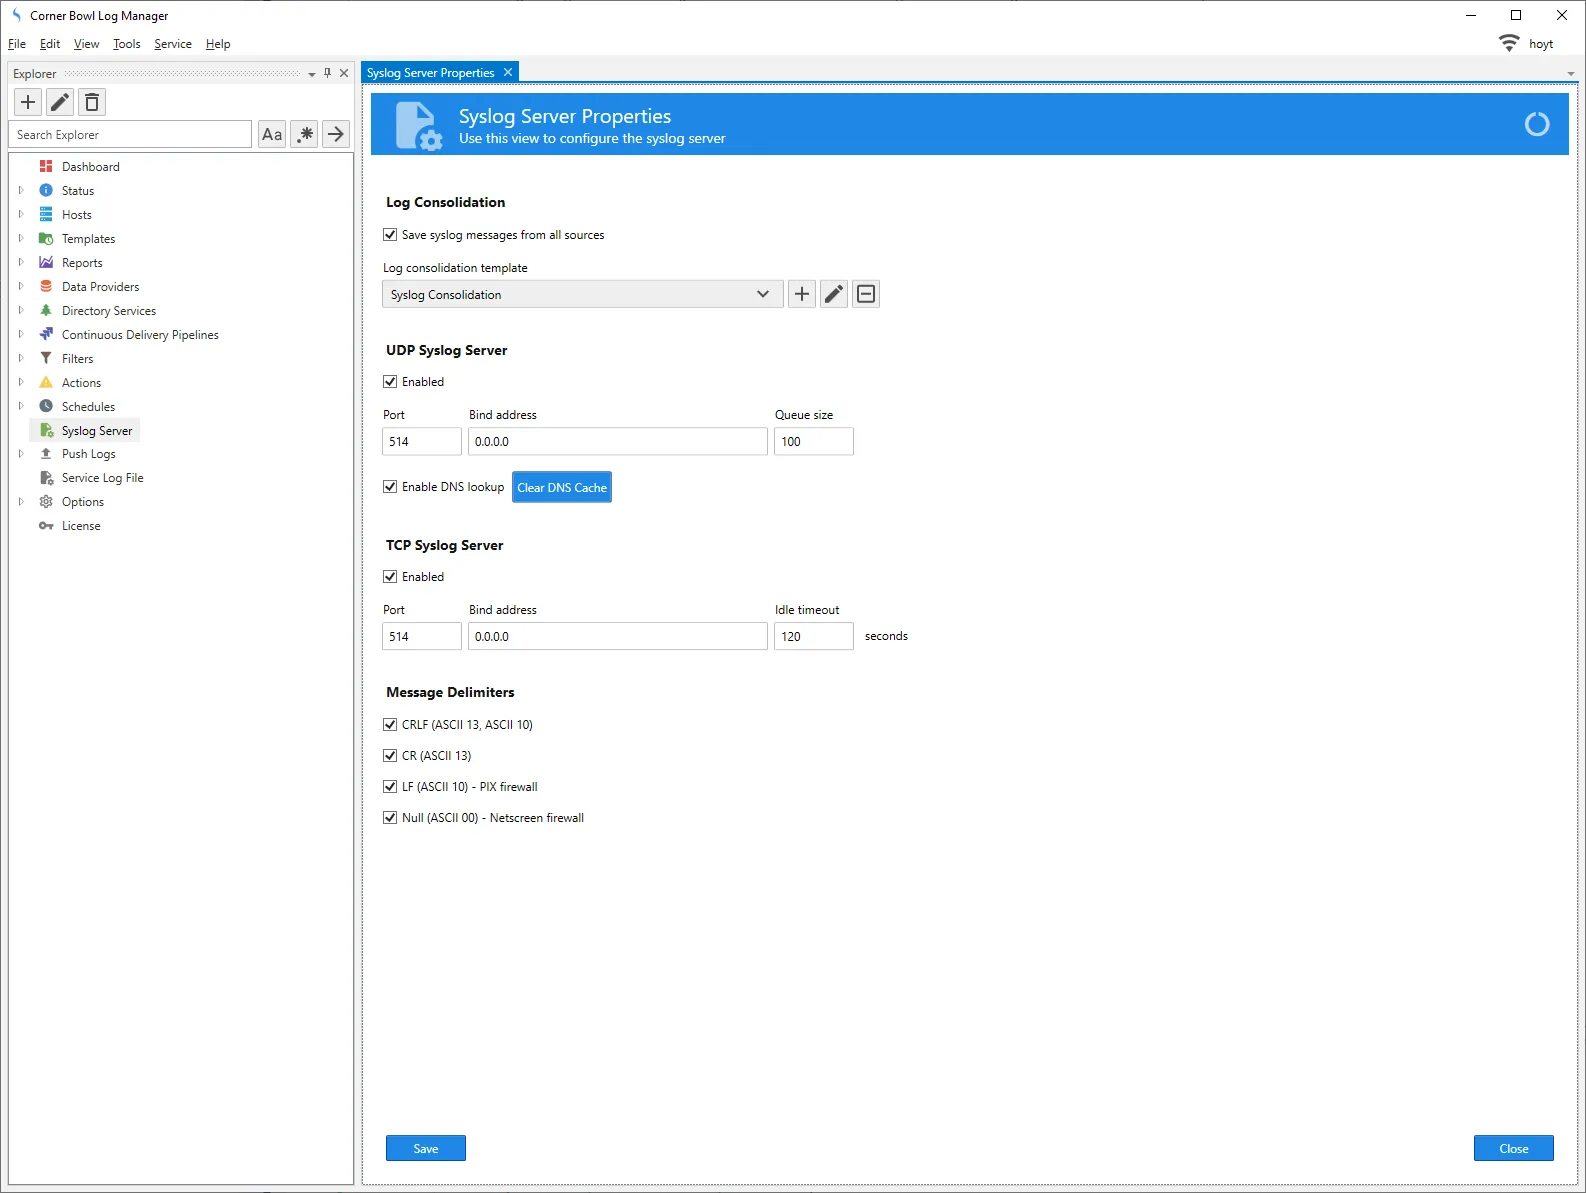
- Back on the Syslog Properties view we need to make sure the UDP Syslog Server is enabled. You have the option to set the Port, Bind address and internal message Queue size.
- If you have Linux machines pushing syslog messages, checking the Enable DNS lookup option allows the software to save the Linux syslog messages under each machine's hostname rather than IP address.
- Next, if you have applications that send messages via TCP rather than UDP, Log Manager includes an optional TCP syslog server.
- Finally, there are some Message Delimiter options that are applied when TCP syslog clients send multiple messages within the same packet.
- If you make any changes be sure to click the Save button to apply the updates.

How to Test the Windows Syslog Server
- To view the status of the syslog server, from the Explorer view click the Dashboard item.
- From the Dashboard locate the UDP Syslog Server and TCP Syslog Server sections.
-
If the server is running you will see the current syslog server statistics otherwise if there is another syslog server running, you will see the following error:
If that's the case locate your other syslog server, shut it down, then restart the Corner Bowl Log Manager service. To restart the service from within Log Manager select Service > Stop then after you are prompted that the service has stopped click Service > Start.Only one usage of each socket address (protocol/network address/port) is normally permitted.

- Now that we have verified the syslog server is running let's test it out. First let's display the global syslog viewer. From the Explorer view locate the Syslog Server item, right click then select Watch.
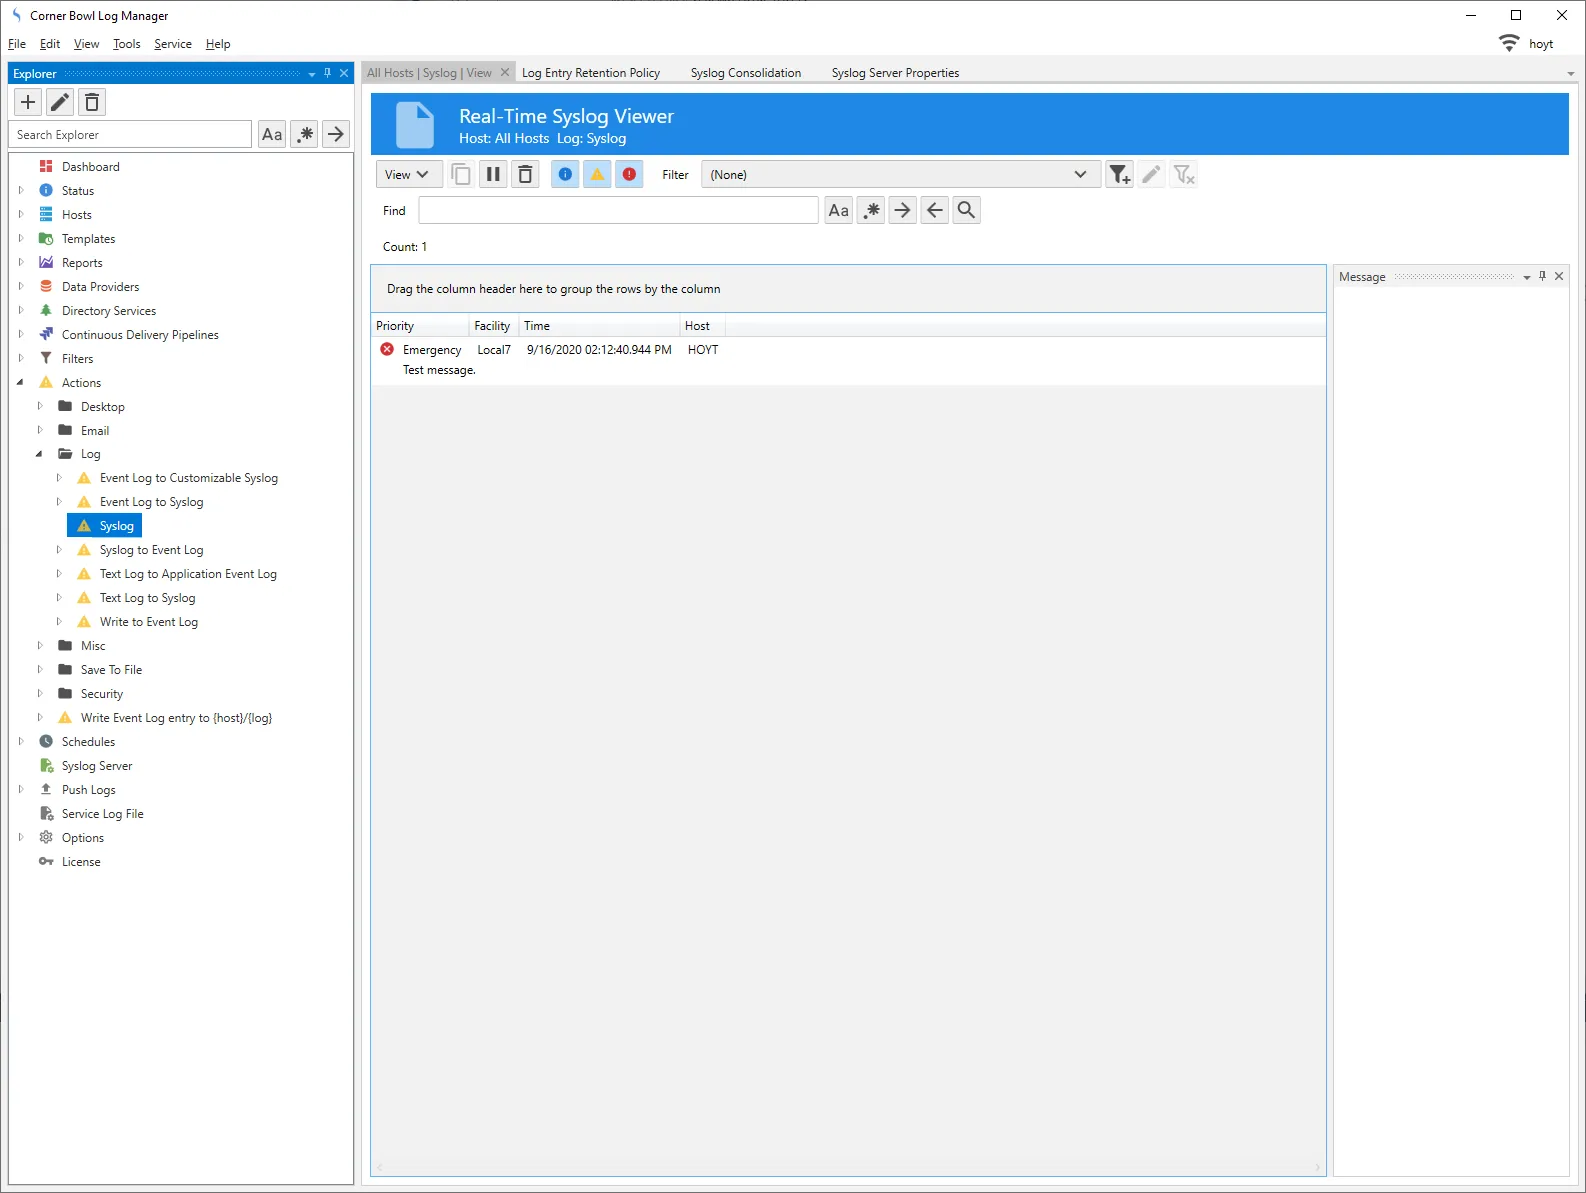
- Once the Real-Time Syslog Viewer is displayed wait a few moments for one of your devices to send a syslog message. If after a few moments messages are displayed we know the server is running and receiving messages. If you do not see any messages then we can test by using Log Manager to send it's own message to the server.
- To send a message to the syslog server from within Log Manager, from the Explorer view expand Actions then Log. Find the Syslog item then right click and select Send test Syslog message.
-
Back in the Real-Time Syslog Viewer we should see our test message.
How to View the Consolidated Syslog Entries
- If we navigate to our localhost in the Explorer view we will now see the pre-built Syslog Consolidation template assigned to our localhost.
-
Expand the Syslog Consolidation item. Notice there is a Syslog item listed. Right click to expose the following popup menu items:
Menu Item Description View View consolidated log entries. Watch Watch the syslog messages for this server. Data Properties View the consolidated log detail such as the data range of consolidated syslog entries, the amount of disk space consumed by the consolidated syslog and syslog priority and facility summary. Explore Display the current status of the monitor. Template Properties Display the template properties Delete Delete the consolidated syslog from the disk. - First let's verify the syslog entries are being saved to the log repository. From the popup menu select View.
-
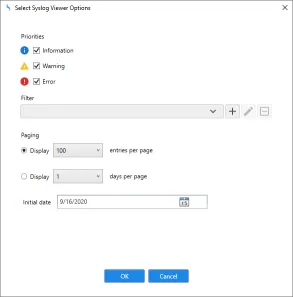
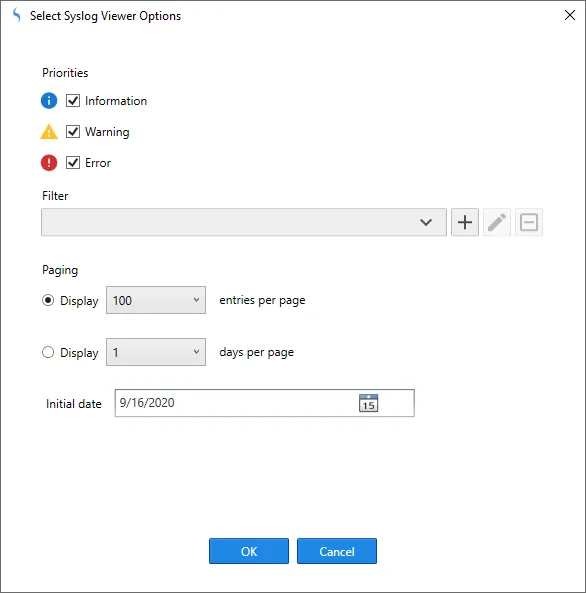
You are prompted to specify priority display filters, a syslog entry filter, paging method which includes two options.
You can page entries by a specific count or you can page entries by a date range.
Finally, you have the option to auto advance to a specific date saving you time when you are looking for something very specific.
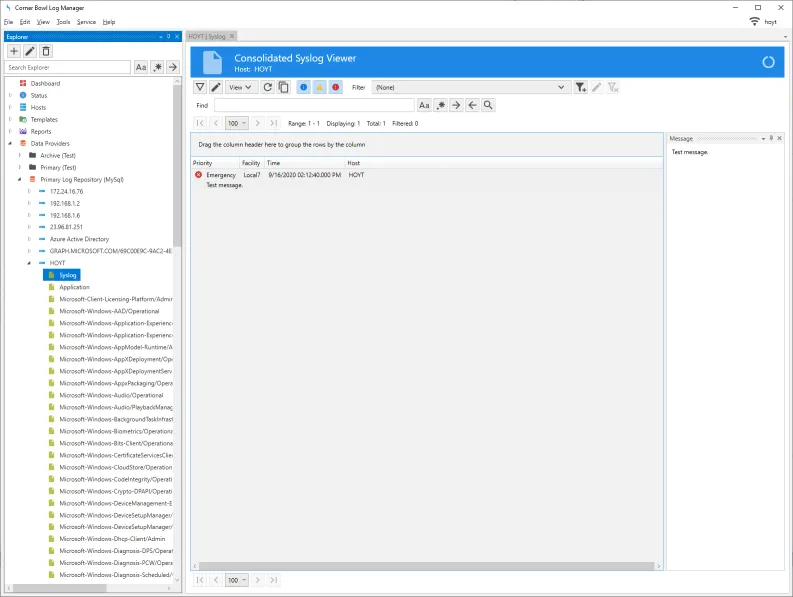
-
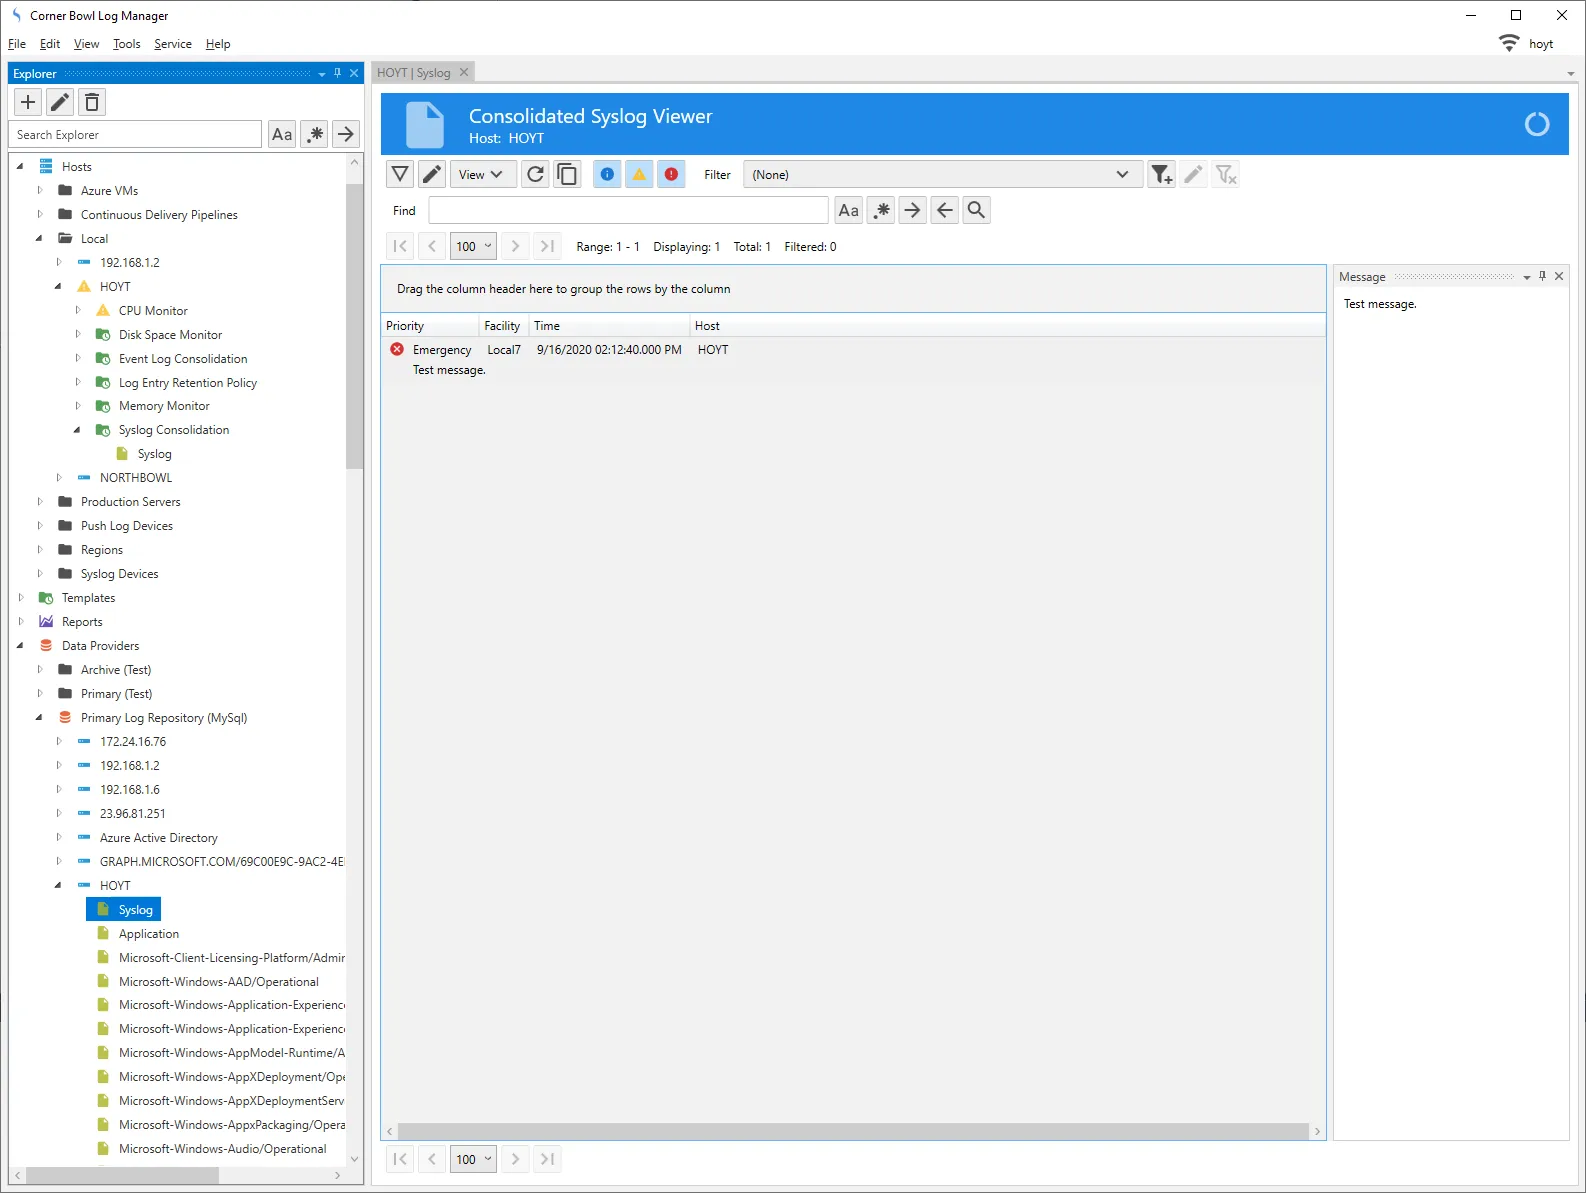
Once I choose the options and click OK we can see the syslog messages we sent via the test Syslog action a moment ago in the Consolidated Syslog Viewer.
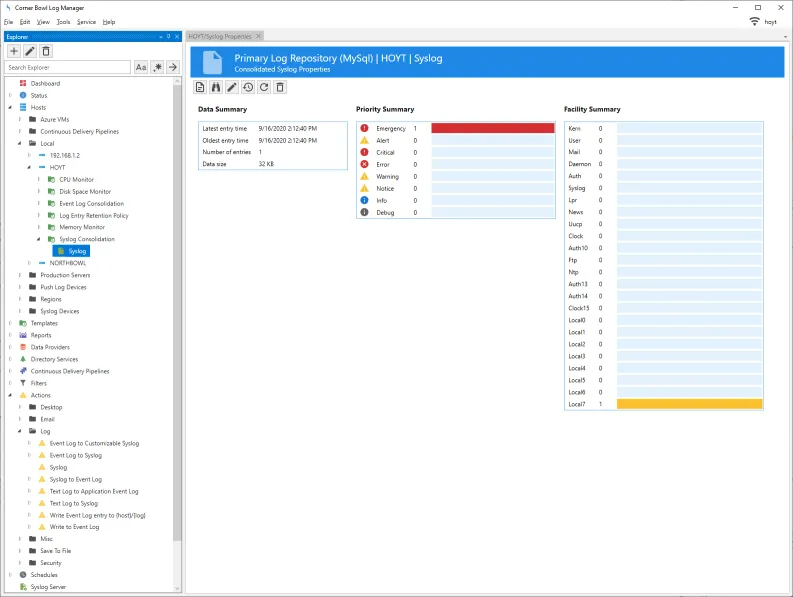
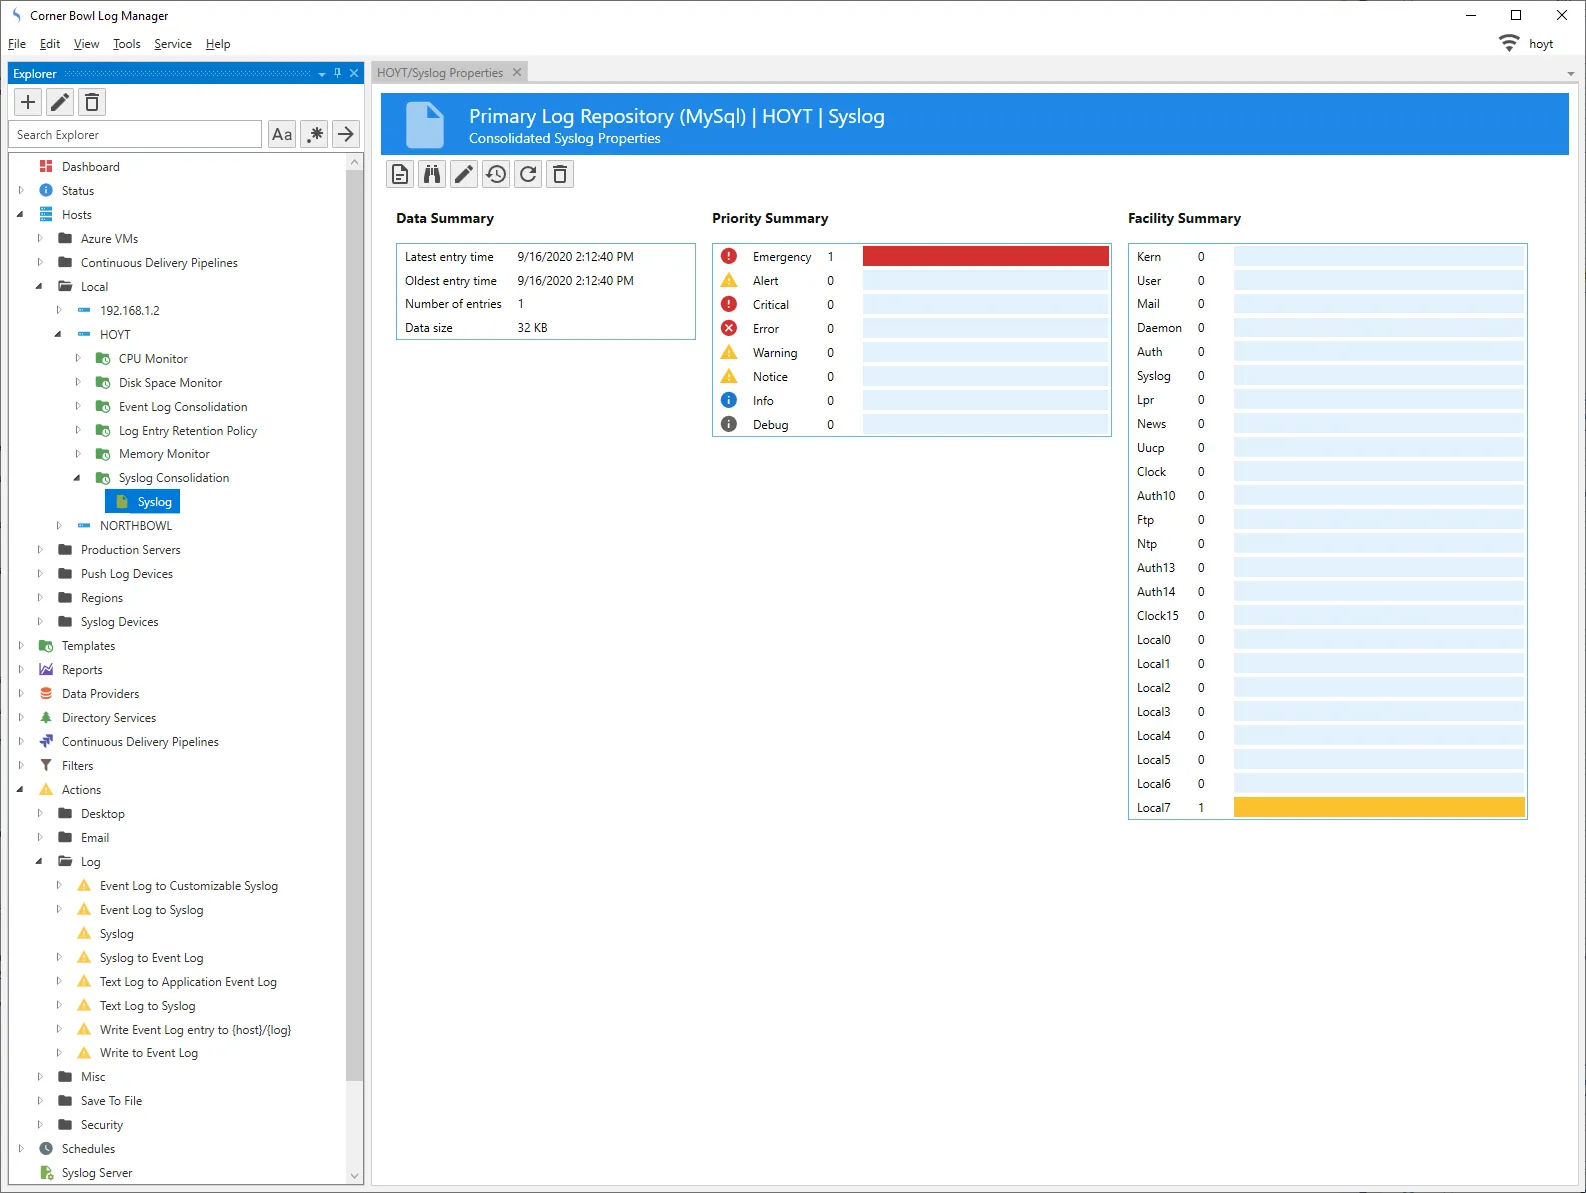
- Next, I want to show the consolidated syslog properties. Back in the Explorer view, right click on the Syslog item again and this time select Data Properties
-
The Data Properties view displays showing several summary tables of information.
- Finally, I want to show you how to view your entire index of consolidated syslog entries. Back in the Explorer view locate and expand the Data Providers item. By default, you will see three nodes, Primary Log Repository, Archive Log Repository and History. If I expand the Primary Log Repository we can see all the machines that have saved data. If I expand my localhost, I can see the syslog and any other logs that have been consolidated.
Last Updated: March, 3rd 2024