Centralized Log Consolidation Databases Tutorial
In this article I am going to show you how to configure Corner Bowl Server Manager to save Event Log Entries, Syslog Messages and text log entries to a central database for monitoring, reporting, auditing and compliance requirements. I am also going to discuss the advantages and disadvantages of each database type.
Corner Bowl Server Manager can centralize log entries to Microsoft SQL Server, MySQL, SQLite and our own file system format. In an effort to provide faster out-of-the-box implementation, our proprietary file system format has been depreciated and replaced by SQLite, an embedded RDBMS that requires no user setup. If you your organization is using the File System format, we suggest migrating to SQLite. The file system format is scheduled to be end-of-lifed sometime in 2024.
Table of Contents
- Background
- How to Configure the Centralized Consolidated Log Databases
- How to Configure SQLite
- How to Configure MySQL
- How to Configure SQL Server
- How to Consolidate Log Entries to the Log Database
- How to View the Log Database Index
- How to View the Log Database Summary
Background
Server Manager uses 2 databases, a primary and an archive. The primary database contains the most recent entries, for example the last 30 days, while the archive database contains data older than the primary database, for example, the previous 6 months. This format enables daily reports to run against the smaller primary database limiting the size of the table scans while simultaneously allowing auditors to scan historical data on-demand without affecting the performance of log consolidation and monitoring.
How to Configure the Centralized Consolidated Log Databases
-
From the Management Console, find the Explorer View, scroll down until
you see Data Providers, then expand. By default, you will find 3 entries,
Primary Log Database, Archive Log Database and History.
- The Primary Log Database contains the most recent log entries.
- The Archive Log Database contains entries older than the Primary Log Database
- The History contains execution status, which includes information such as the number of Event Log Entries saved.
- To view the Log Database Properties, right click and select Properties. The Data Provider View displays.
- From the Data Provider View, use the Type drop-down to select the database type, either SQLite, MySQL, Microsoft SQL Server or the File System.
-
Use the Role drop-down to select how you would like to use the database. The following Roles are available:
Role Description Log Database Contains the latest consolidated log entries. (e.g. log entries less than 30 days old). Archive Log Database Contains archived consolidated log entries previously saved to the Log Database (e.g. log entries 30 days and older). Auxiliary Log Database Contains auxiliary or backup consolidated logs. Typically used to view old database backups for auditing purposes. History Database Only available when using the File System. Contains monitor and report execution history (e.g. execution time, state, and results such as the number of entries downloaded). None This setting has two purposes. First, to be used for Database Monitoring. Second, to be used to maintaining database connection settings for later use. - Configure the database type specific settings.
- Click the Test button to check the settings.
-
Click the Save button to save the settings.
NoteWhen saving a Log Database or Log Archive Database, if the database does not exist, the database and several tables are automatically created.
-
Click Delete to permanently delete this object.
ImportantLog Database and Archive Log Database objects cannot be deleted.
How to Configure SQLite
SQLite provides out-of-the-box RDBMS support so there is nothing to download and install. SQLite was introduced in the Summer of 2022 and replaces the Corner Bowl File System format as the default provider eliminating the need to create large temporary files when saving Event Log entries to the centralized database while simultaneously adding date/time column index support for faster reporting.
-
From the Path text box, either manually enter the target path or click the Browse
 button to select the database path and filename.
If you browse, the Select File dialog displays.
NoteSince the Management Console is a client that can be installed anywhere, the Select File dialog is a proprietary view that displays the file system from the service's point of view.
button to select the database path and filename.
If you browse, the Select File dialog displays.
NoteSince the Management Console is a client that can be installed anywhere, the Select File dialog is a proprietary view that displays the file system from the service's point of view. - From the Select File dialog, select the file to save log entries then click OK.
- Use the Connection timeout text box to specify the maximum time to wait for an available connection in the connection pool before timing out.
-
Use the Execution timeout text box to specify the maximum time to wait for SQL statements to complete before timing out.
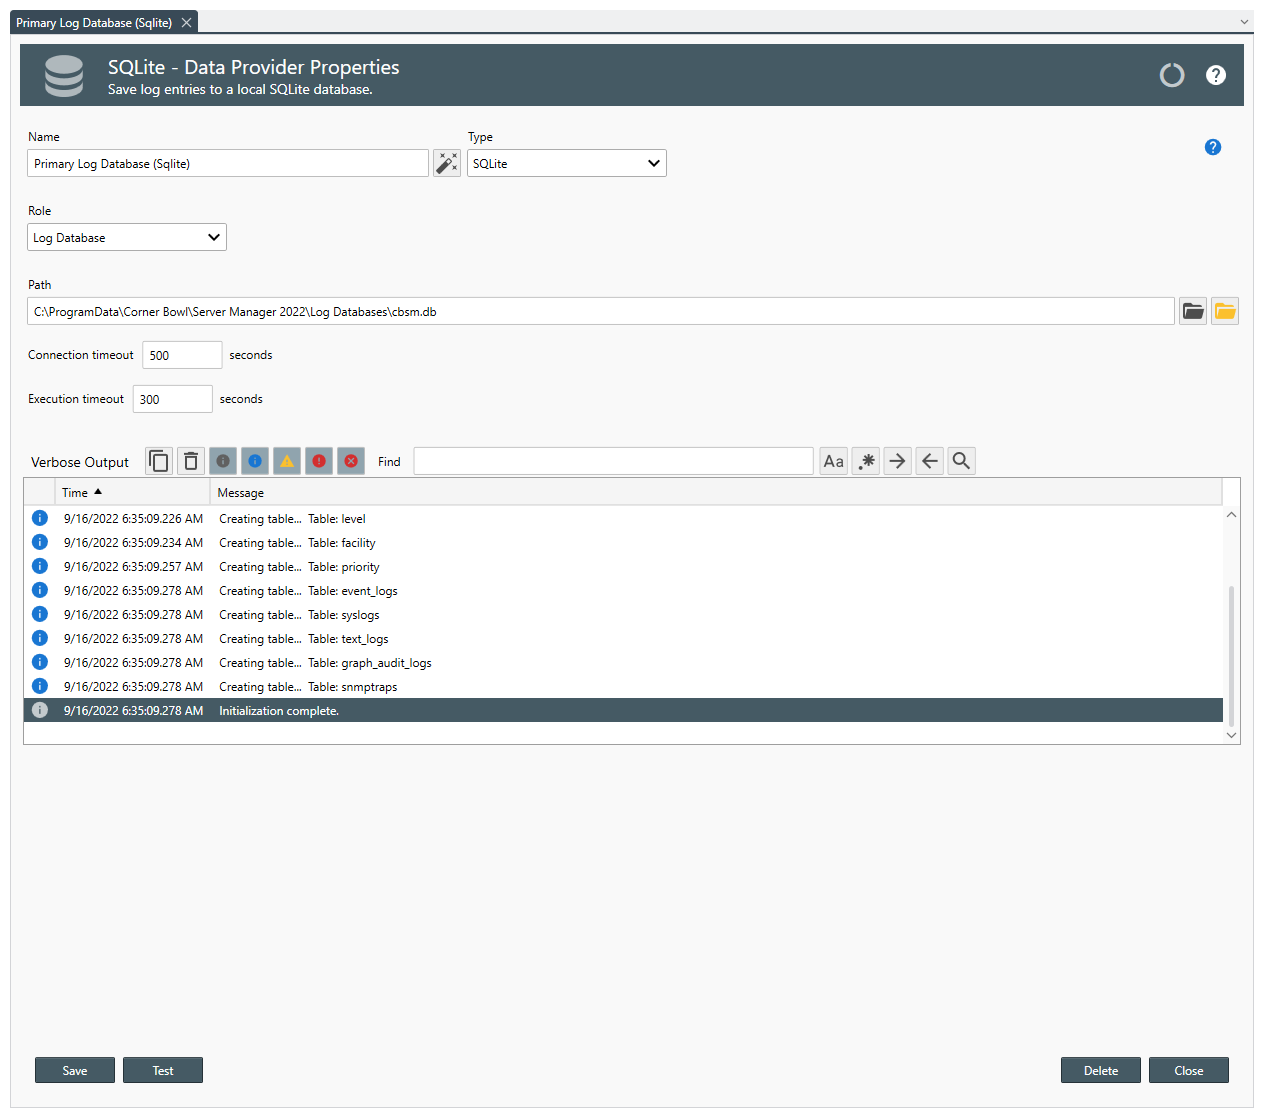 Centralized SQLite Consolidated Log Database Properties
How to Configure MySQL
According to Oracle, MySQL is the world's most popular open-source database and includes a free community edition which can be downloaded from:
https://www.mysql.com/downloads/
-
Use the Server text box to specify the hostname the MySQL database is installed.
NoteIf the database is installed on the localhost, specify localhost.
- Use the Database text box to specify the database.
- Use the Username text box to specify the MySQL user name.
- Use the Password text box to specify the MySQL user's password.
- Use the Connection timeout text box to specify the maximum time to wait for an available connection in the connection pool before timing out.
- Use the Execution timeout text box to specify the maximum time to wait for SQL statements to complete before timing out.
-
Check Hash Mode to add hashing to each saved log entry often used in Italy to fulfill government compliance requirements.
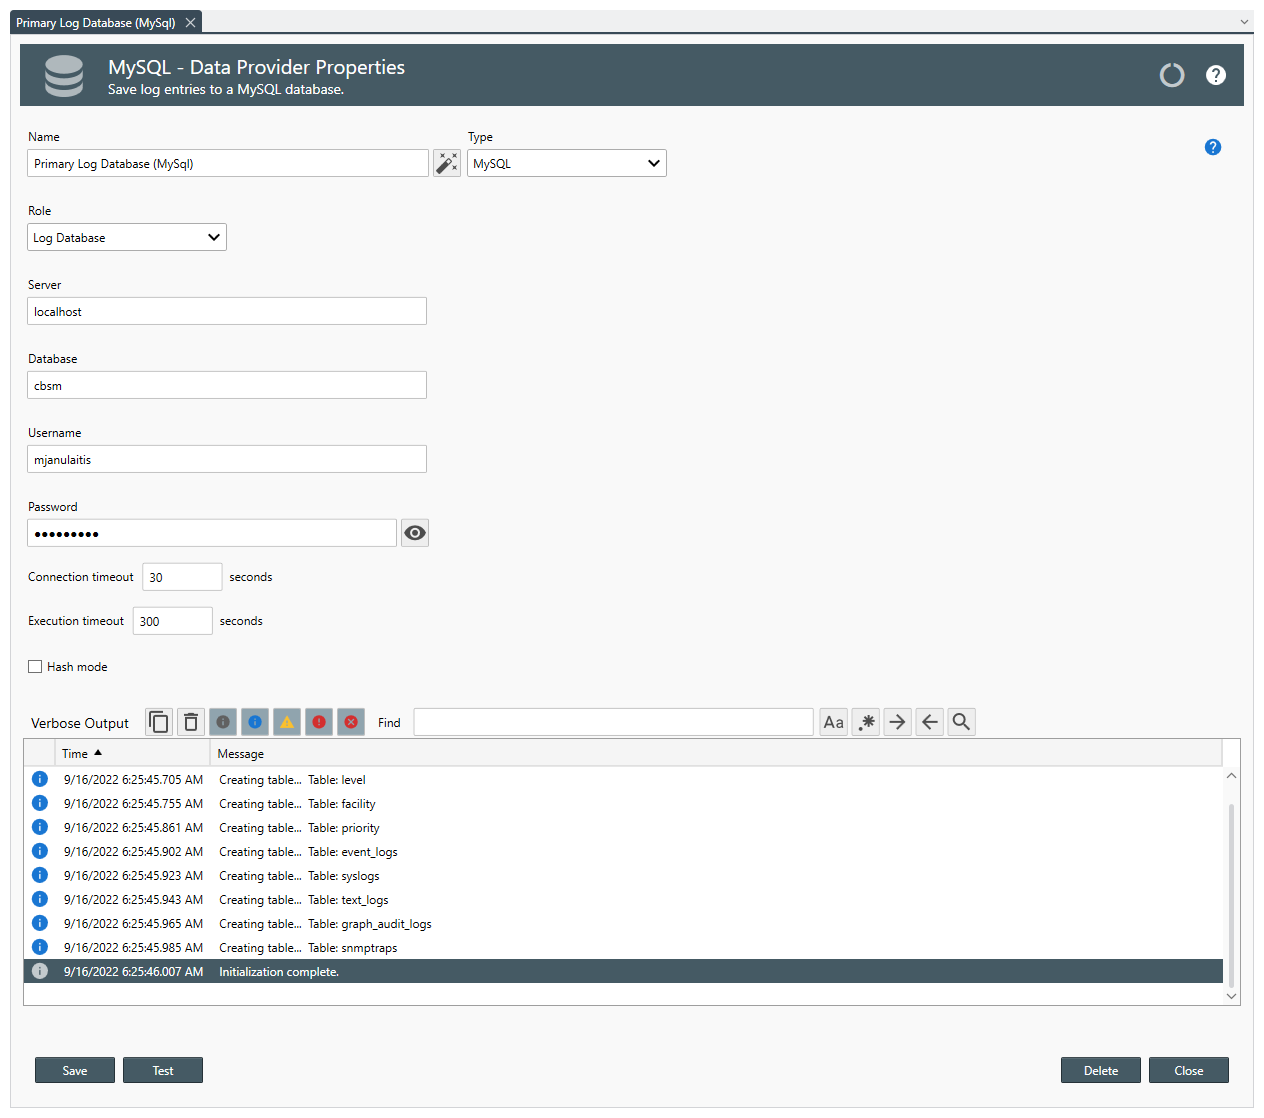 Centralized MySQL Consolidated Log Database Properties
How to Configure SQL Server
SQL Server is the fastest option available and includes support for insert batching significantly increasing the throughput of Syslog messages.
- Use the Server text box to specify the SQL Server hostname and instance.
- Use the Database text box to specify the database.
-
Use the Authentication Method drop-down to select either:
Option Description Integrated Windows Authentication Uses the service credentials to connect. SQL Server Authentication Uses a SQL Server defined user to connect. -
When using SQL Server Authentication:
- Use the Username text box to specify the SQL Server user name.
- Use the Password text box to specify the SQL Server user's password.
- Use the Connection timeout text box to specify the maximum time to wait for an available connection in the connection pool before timing out.
- Use the Execution timeout text box to specify the maximum time to wait for SQL statements to complete before timing out.
- Use the Maximum connection pool size text box to specify the maximum number of connections to allow. The default value is 100.
- Check Encrypt connection to enable SQL Server packet encryption.
- Check Hash Mode to add hashing to each saved log entry often used in Italy to fulfill government compliance requirements.
-
Use the Encoding drop-down to enable Unicode support.
ImportantWe have seen cases where after creating the database an access denied error is immediately thrown. If this occurs, click the Save button again. If the error persists, verify the authentication method is valid. Make sure to configure both your primary and archive log databases.
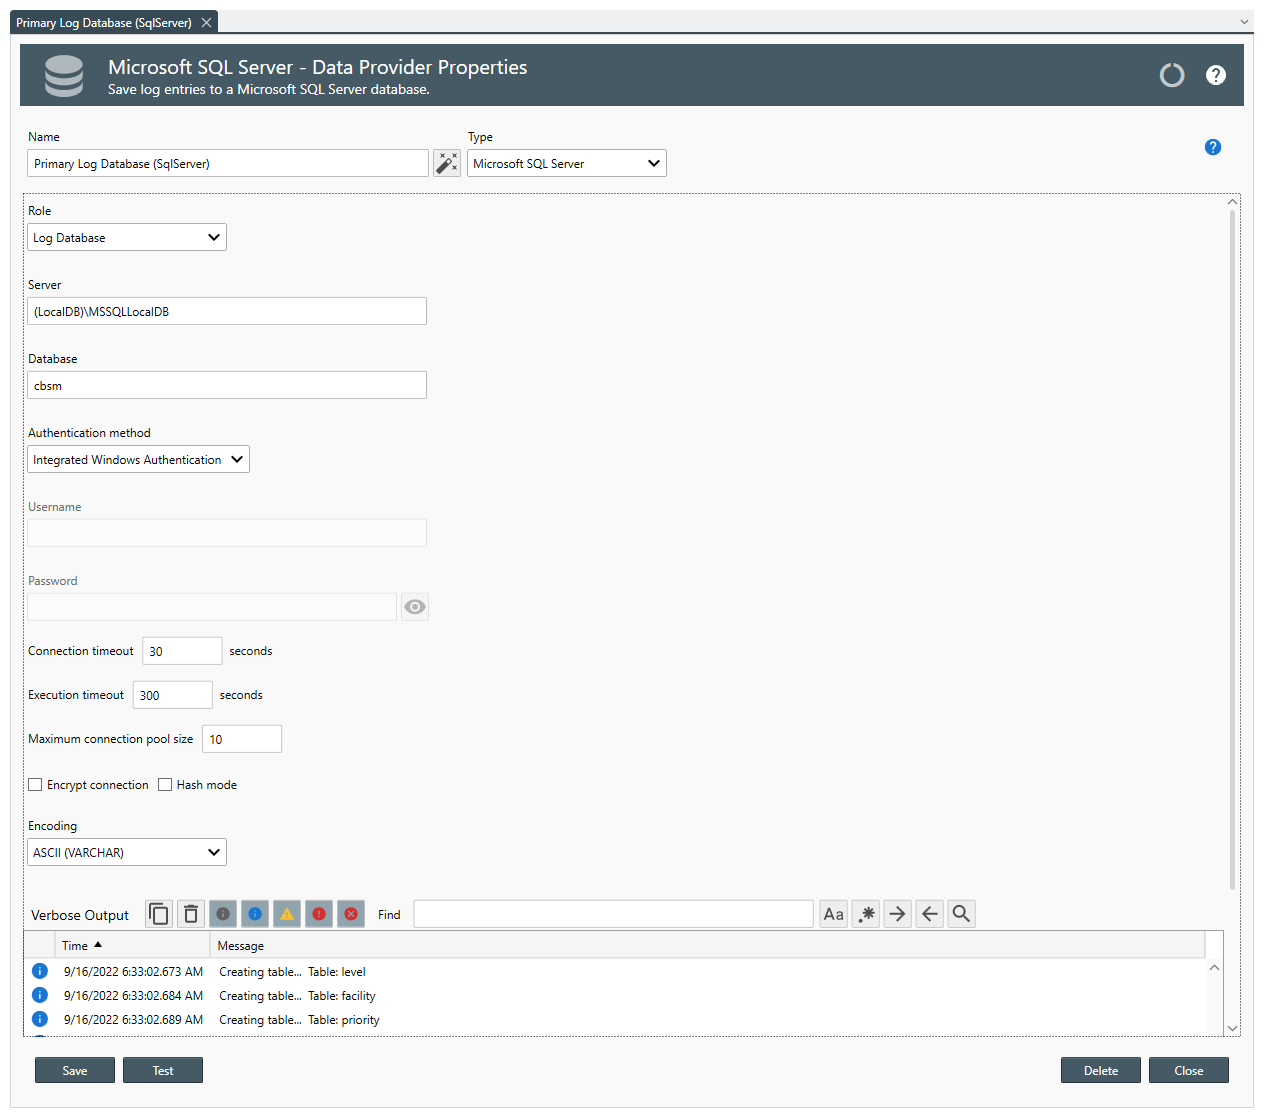 Centralized SQL Server Consolidated Log Database Properties
How to View the Log Database Index
For information on configuring log consolidation please see either one of the following tutorials:
- To see what has been saved to the database, from the Explorer View, find the root Data Providers node then expand.
- Next, expand the Primary Log Database.
- Once expanded you will find two nodes, All and Hosts.
- Expanding All reveals each host that contains saved log entries without any grouping.
- Expanding Hosts reveals your root Hosts node structure.
- Expanding any host reveals all saved logs.
-
To view a log, right click then select View.
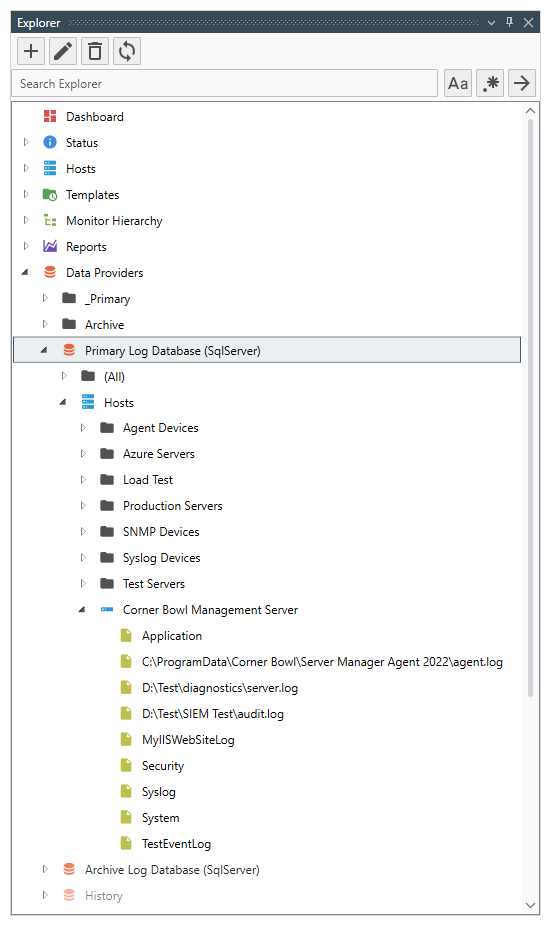 Centralized Consolidated Log Database Index
How to View the Log Database Summary
- To view a summary of the content in your primary log database, from the Explorer View, select the Dashboard node. The Dashboard View displays.
- From the Dashboard View, select the Log Database Summary Tab. The summary is executed and asynchronously return results one by one as they are received.
-
Notice the scroll bar at the bottom. The summary may take several minutes to complete.
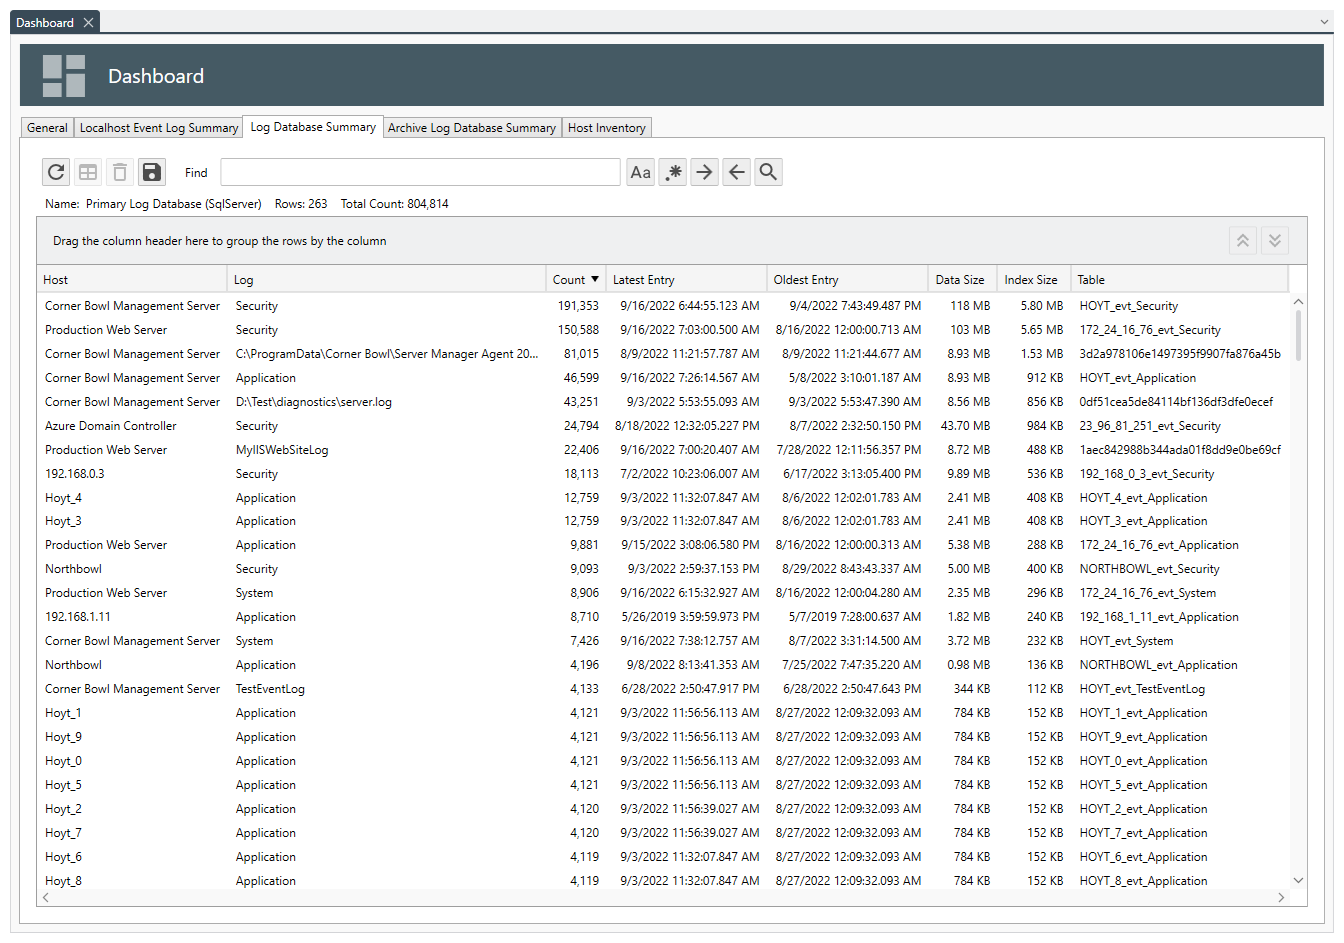 Centralized Consolidated Log Database Summary
 - To view more detail about a specific saved log, right click on the row then select Data Properties. The Data Properties View displays.
-
Depending on the log type the Data Properties View will display summary data, for example, the number of Event Log Entries grouped by Level and Event ID.
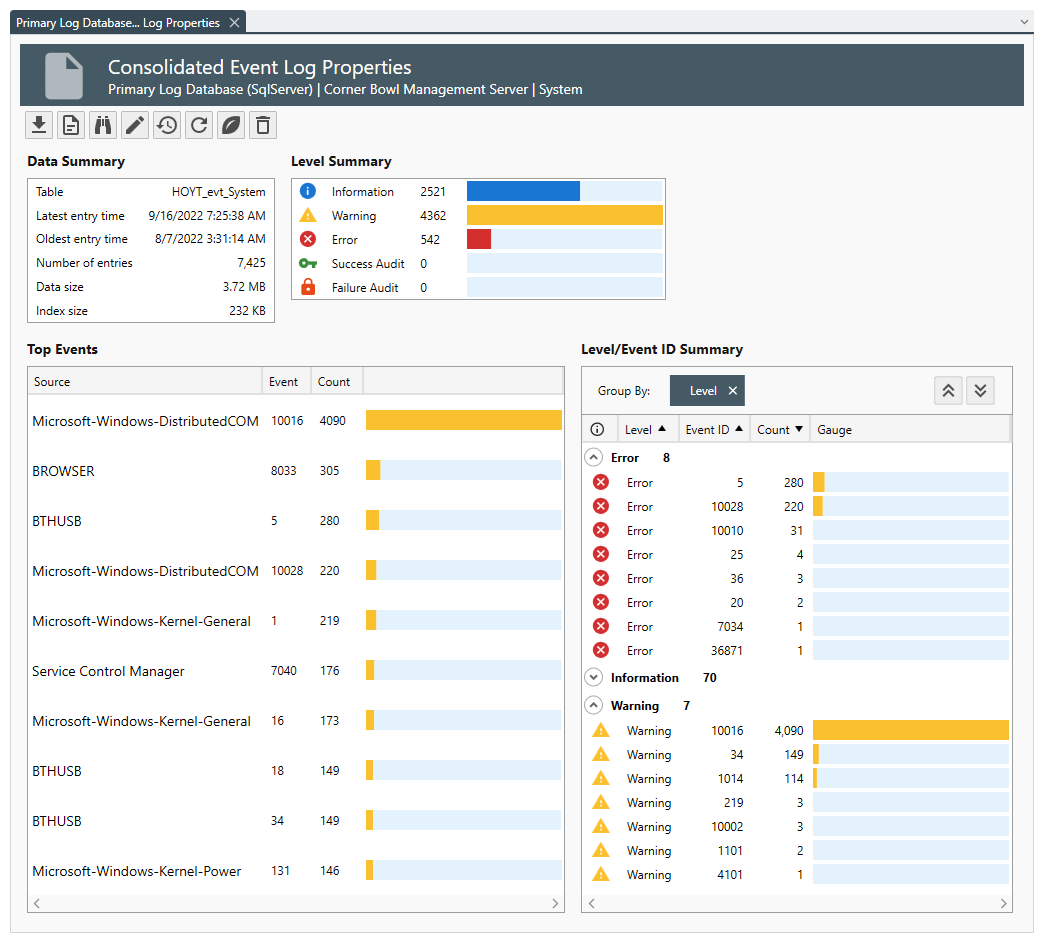 Centralized Consolidated Log Summary
That's all I have for today. I hope this article has helped you better understand how to configure the centralized log databases and how to view the available consolidated log summary information.