IIS Log Monitoring, Consolidation and Reporting (Part 2)
This is part 2 of a 3 part video set in which I will show you how to monitor IIS logs and get notified when there is a 500 error.
- In Part 1 I showed you how to save IIS log entries to a SQL Server database with table columns for each field.
- In Part 3 I will show you how to generate a daily report of HTTP 404 and 500 errors.
Table of Contents
- How to Create a Filter
- How to Configure the Log Monitoring Template
- Testing the Log Monitor
- How to Limit Emailed Columns
How to Create a Filter
To get notified of a specific event, we need to first create a filter that targets the log entries of interest. The easiest way to create our filter is to view the consolidated log entries, find an entry we want to be notified about then create a filter that is based off of the entry.
- From the Explorer View, expand Hosts then navigate to the target host, expand, find your W3C File Consolidation (u_ex<yyMMdd>.log) template, then expand. Here you will fine the current file being monitored. Right click on the file then select View. The Select Log Viewer Options Dialog displays.
-
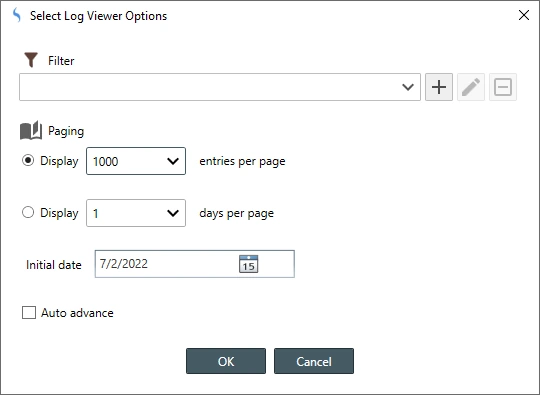
Since we want to view a large number of entries so we can find a target entry, from the Select Log Viewer Options Dialog, select to Display 1000 entries per page, then click OK. The Consolidated Text Log Viewer displays.
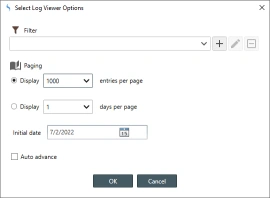 IIS Log Viewer Options
 -
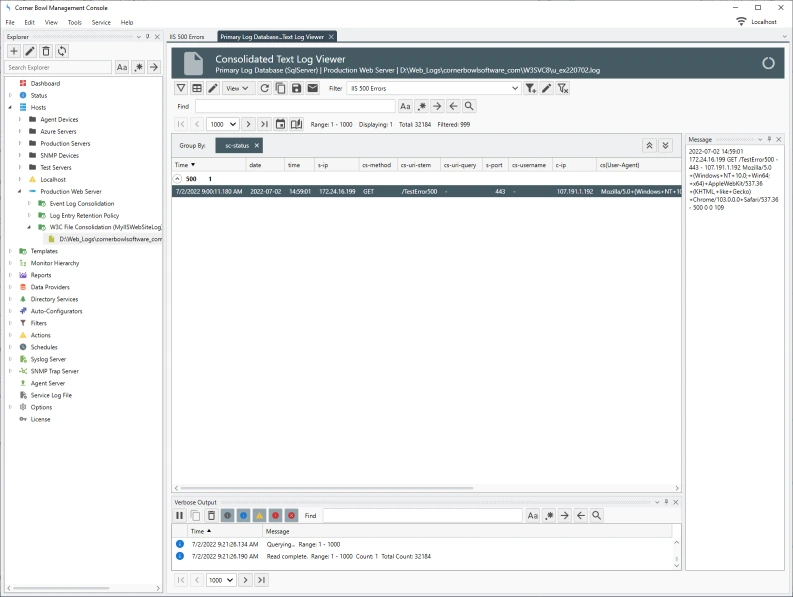
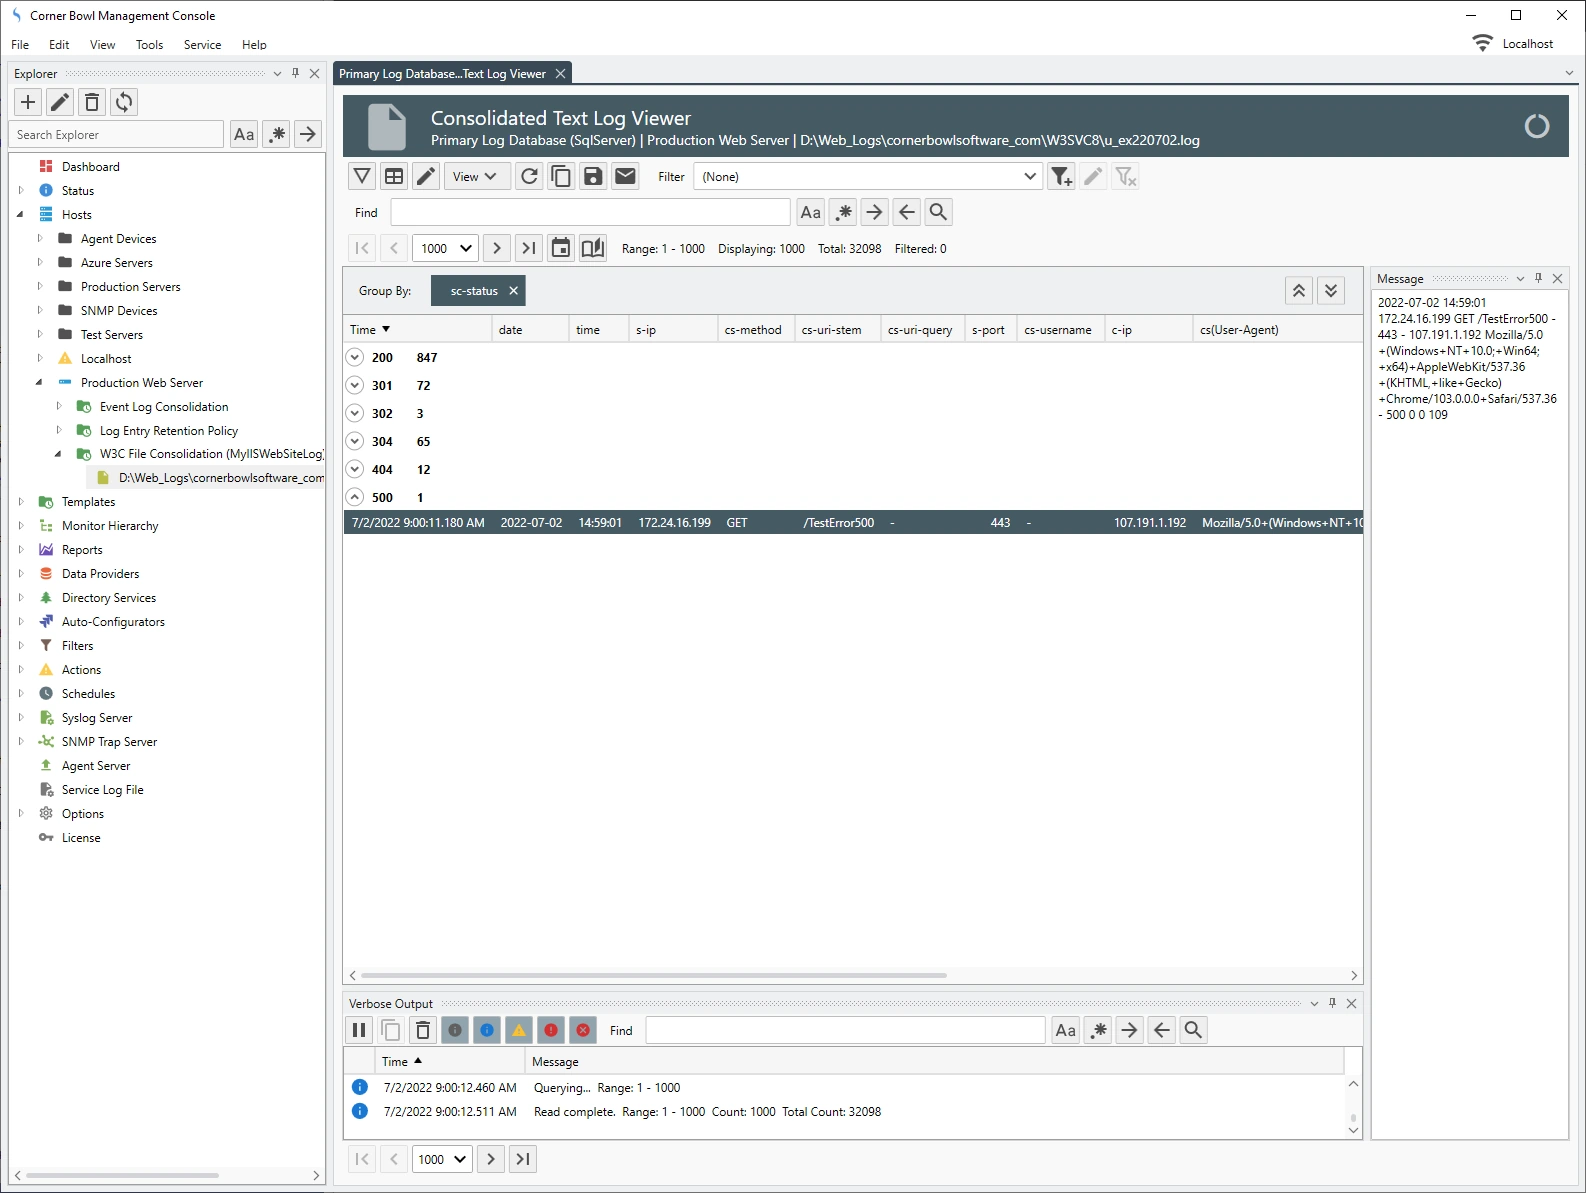
From the Consolidated Text Log Viewer, find the sc-status column then drag it to the group by header. The viewer groups all of the entries by the status code.
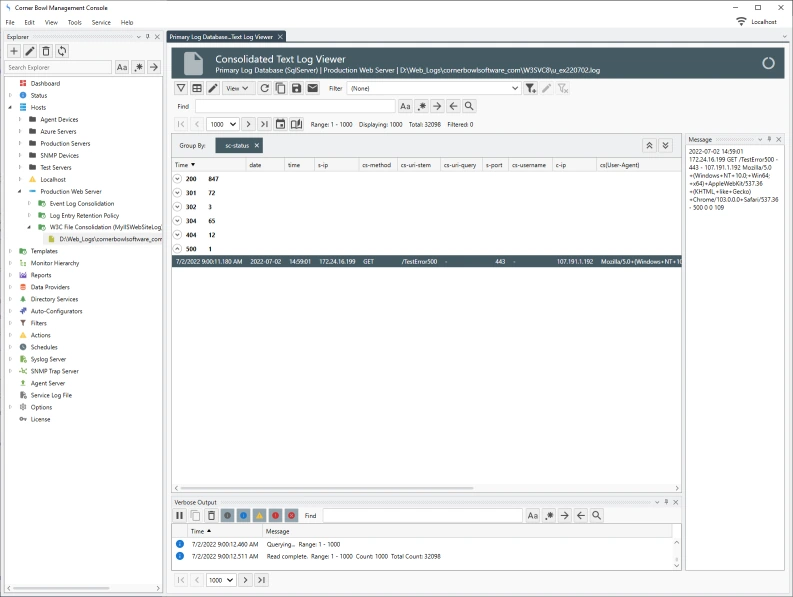 Consolidated IIS Log Viewer
 - Find a 500 error, right click then select Filter Selected Entries. The Filter Selected Entries Dialog displays.
-
From the Filter Selected Entries Dialog, de-select the Include the message in the filter then specify a name, for example IIS 500 Errors, then click OK.
 IIS 500 Error Filter
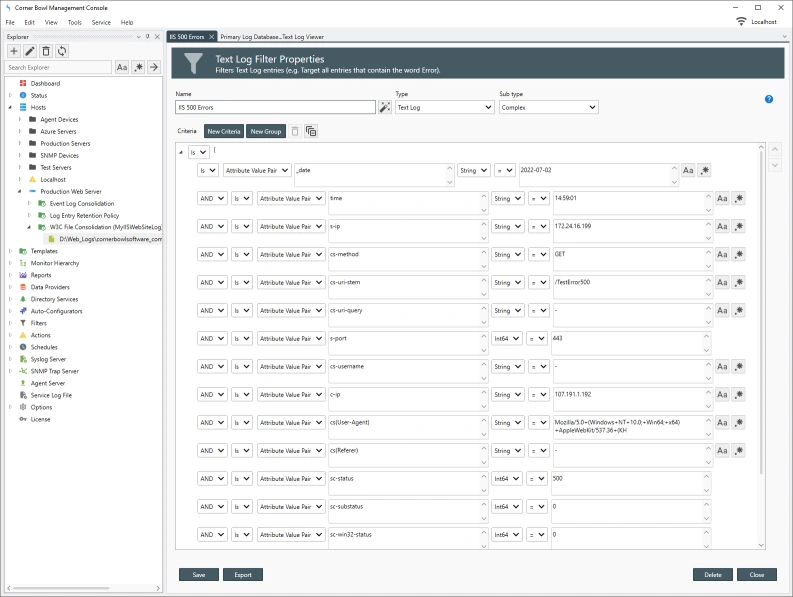
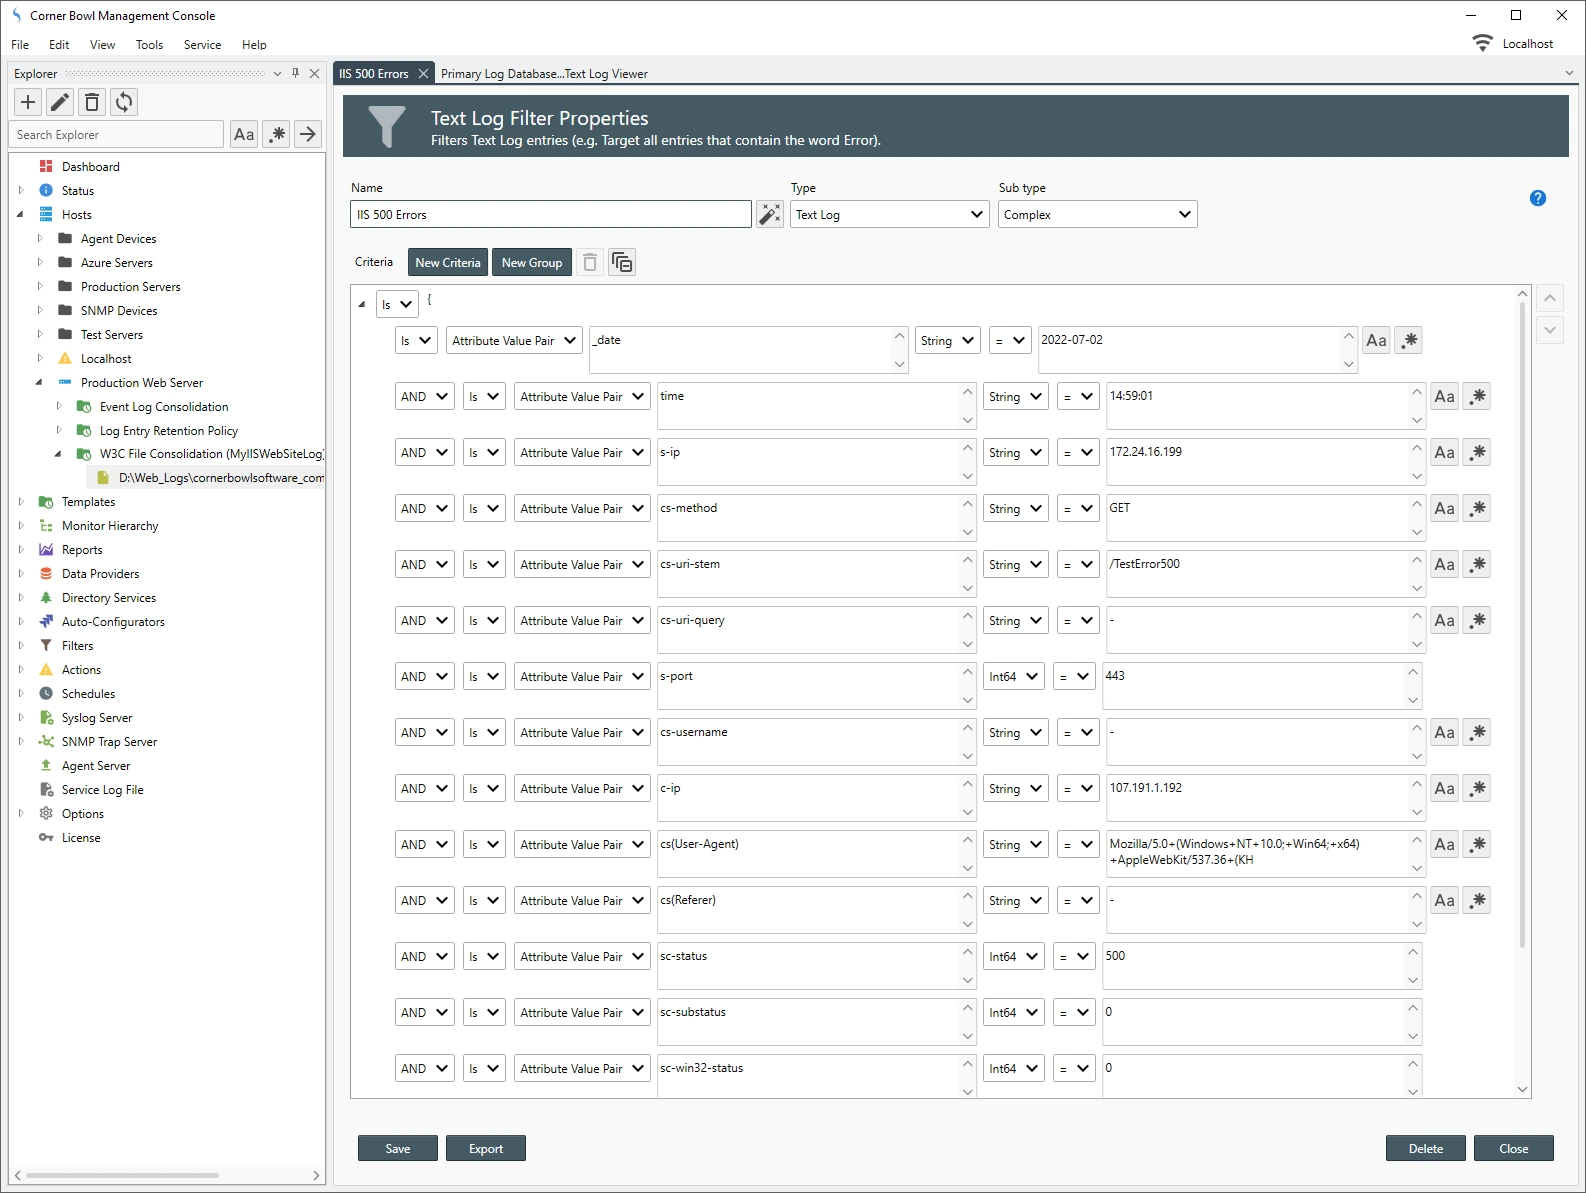
 - The filter is created then the Text Log Filter Properties View displays.
- From the Text Log Filter Properties View, delete all of the filter criteria except for the sc-status row.
- Notice the criteria is in a group. Since we only have one criteria we can remove the group. First, we need to move the criteria out of the group then we can delete the group.
- To move the criteria out of the group, select the criteria then click the Up
 button.
 - To delete the group, select the group then click the Delete
 button.
 -
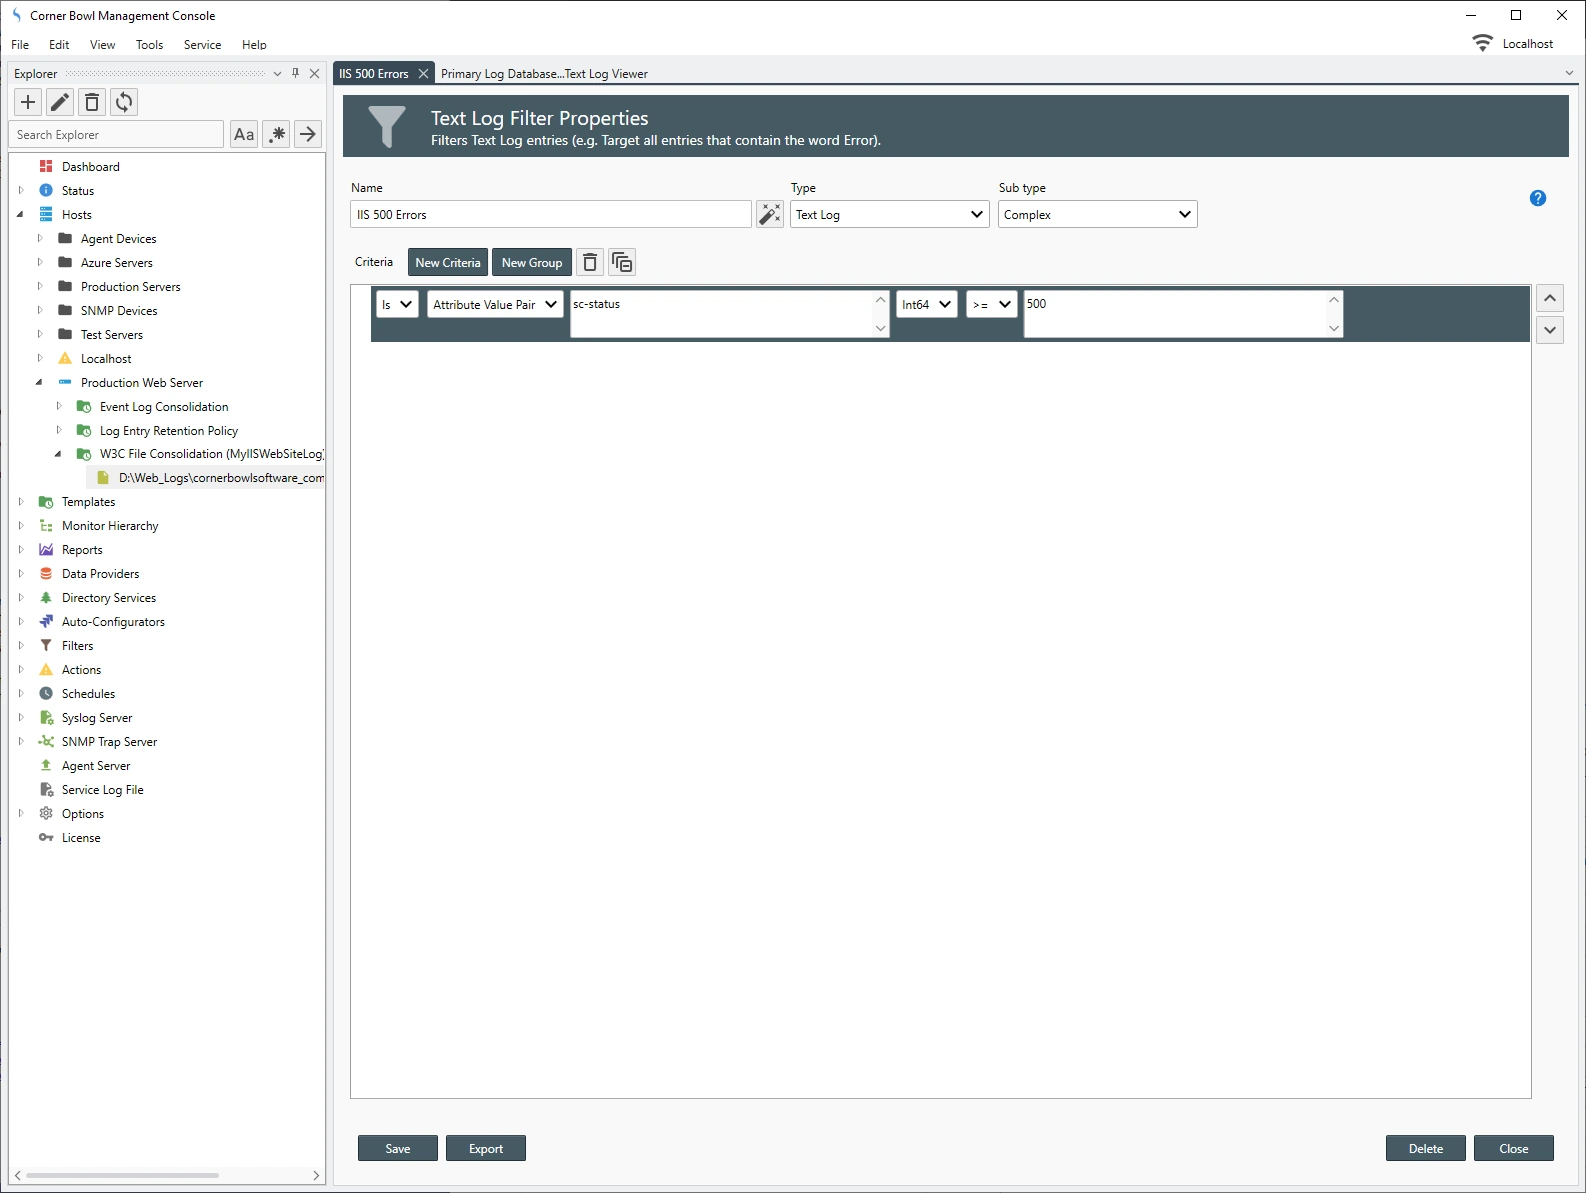
Finally, click Save to save your changes.
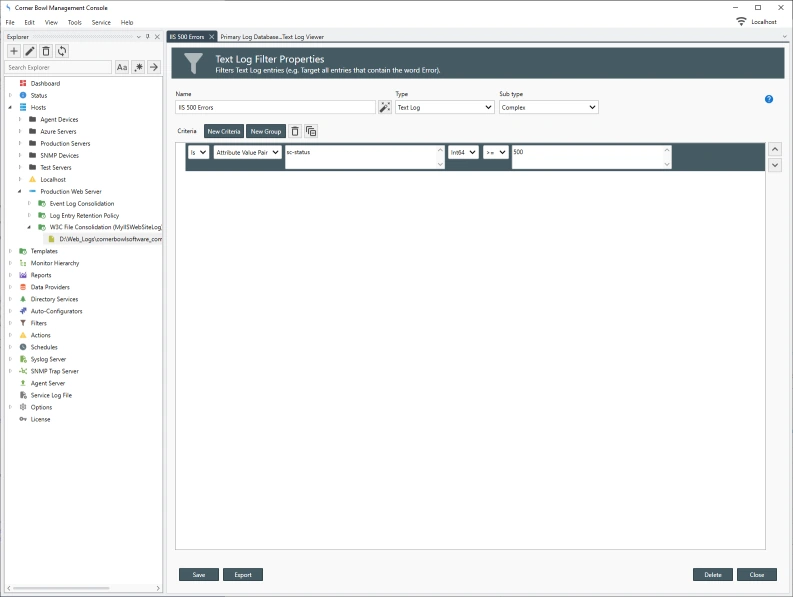 Complete IIS 500 Error Filter
 - To verify the filter is working as expected, go back to the log viewer then from the Filter drop-down, located in the toolbar, select the IIS 500 Errors filter.
-
Verify the viewer only displays the entries of interest.
 IIS Log Viewer with IIS 500 Error Filter Applied

How to Configure the Log Monitoring Template
Now that we have a working IIS log entry filter, let's assign the filter to the log consolidation template.
- Back in the Explorer View, right click on the W3C File Consolidation (u_ex<yyMMdd>.log) template then select Template Properties. The Template Properties View displays.
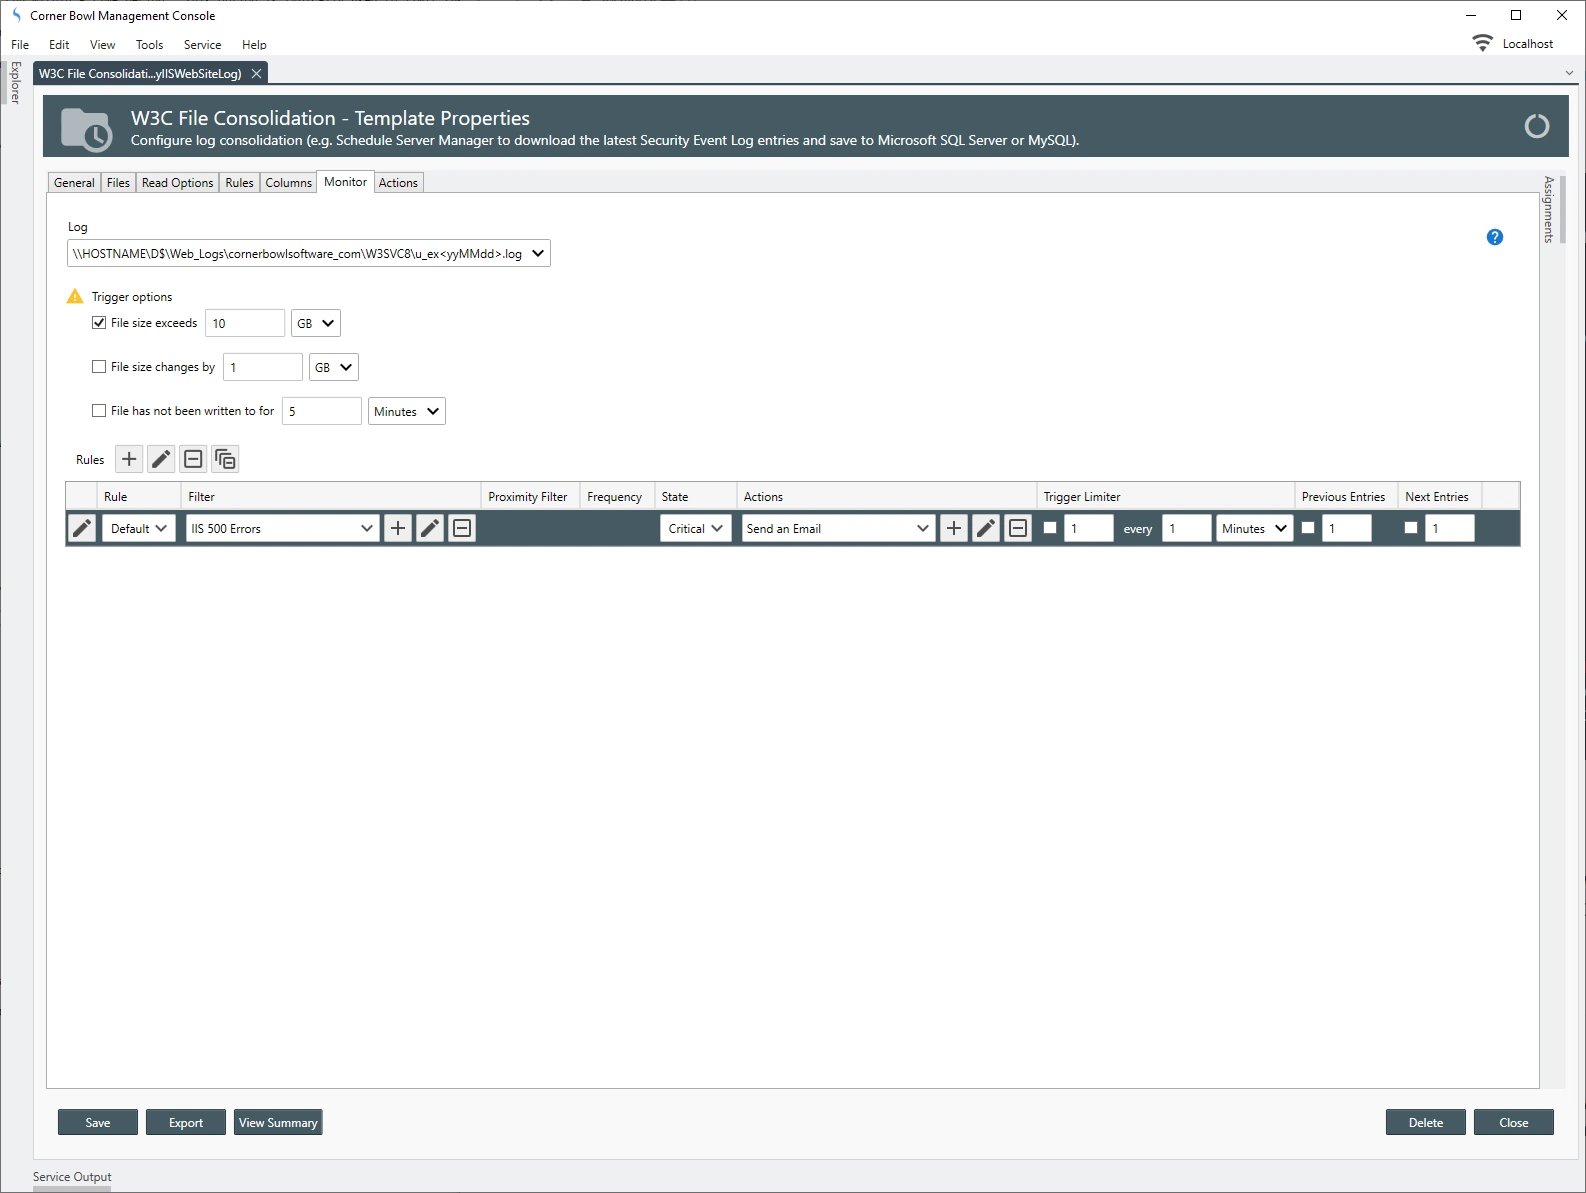
- From the Template Properties View, select the Monitor Tab.
-
The Monitor Tab includes several file monitors, including file size, change in size and idle file monitors. You can optionally set any or all of these if necessary.
NoteI personally use the change in size option to track PCI Compliance scans and fishing and DoS attacks.
- From the Rules controls, click the Add button. A new filter criteria line item is added.
-
Use the Rule drop-down to select the desired rules. The following options are available:
Since our goal is to get notified when 500 errors are encountered, use the Default option.Option Description Default The Default setting triggers assigned actions when any entries are found. Frequency The Frequency option enables you to suppress actions until a number of the entries are found, for example 100 entries. Proximity The Proximity option enables you to scan for patterns, for example started and stopped messages. - Use the Filter drop-down to select the IIS 500 Errors filter we previously created.
- Use the State drop-down to select the trigger level. Since we are monitoring 500 errors which are internal server errors, select Critical.
- Use the Actions drop-down to select the action to trigger. To select multiple actions, add each action individually.
- Use the Tigger Limiter to limit the number of triggered actions run within a time period. This option is typically used to limit the number of email notifications received throughout the day.
- Use the Previous Entries column to include the previous x number of entries in the triggered actions.
- Use the Next Entries column to include the next x number of entries in the triggered actions.
-
Click Save to save your changes.
 IIS Log Monitor Rules
Testing the Log Monitor
Now let's test our monitor.
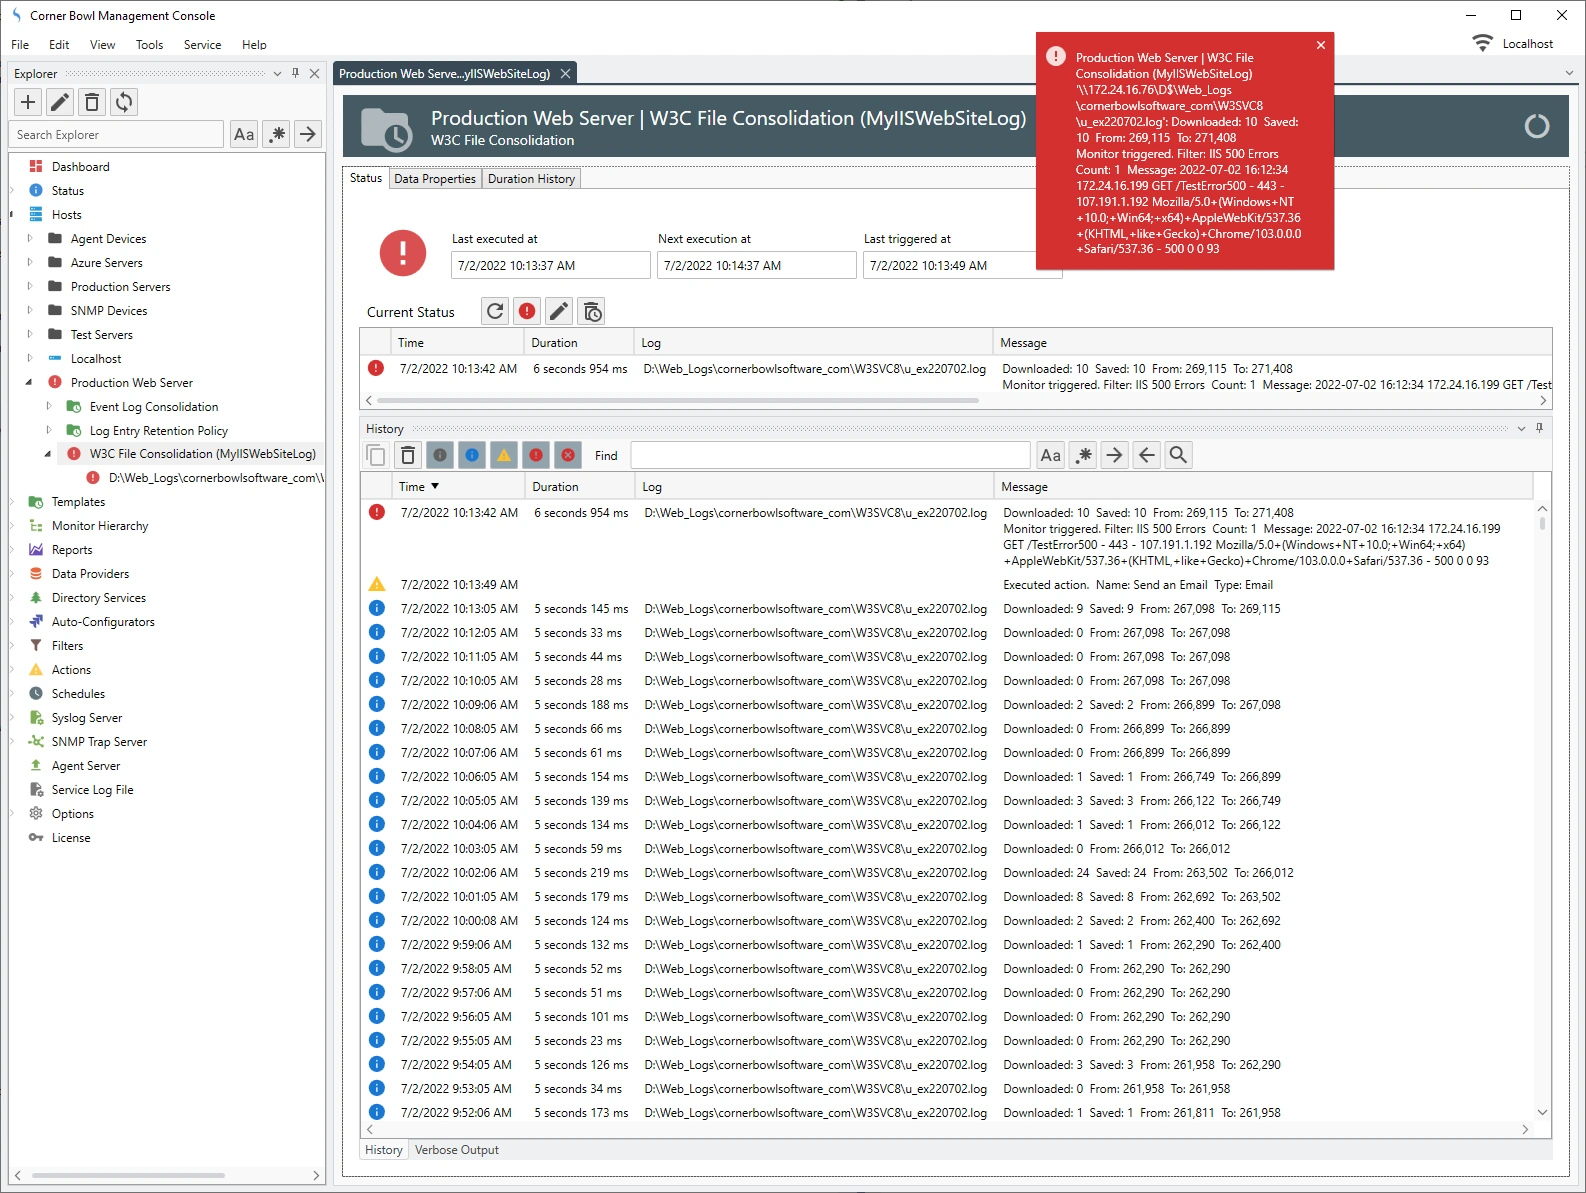
- From the Explorer View, right click on the template under your website host then select Explore. The Monitor Status View displays.
- Next, open up a browser and trigger your website to throw a 500 error.
ImportantIf you are unable to create 500 errors on demand, modify your filter to look for 404 not found errors then, to trigger a 404 not found error, navigate to a bogus page on your website.
-
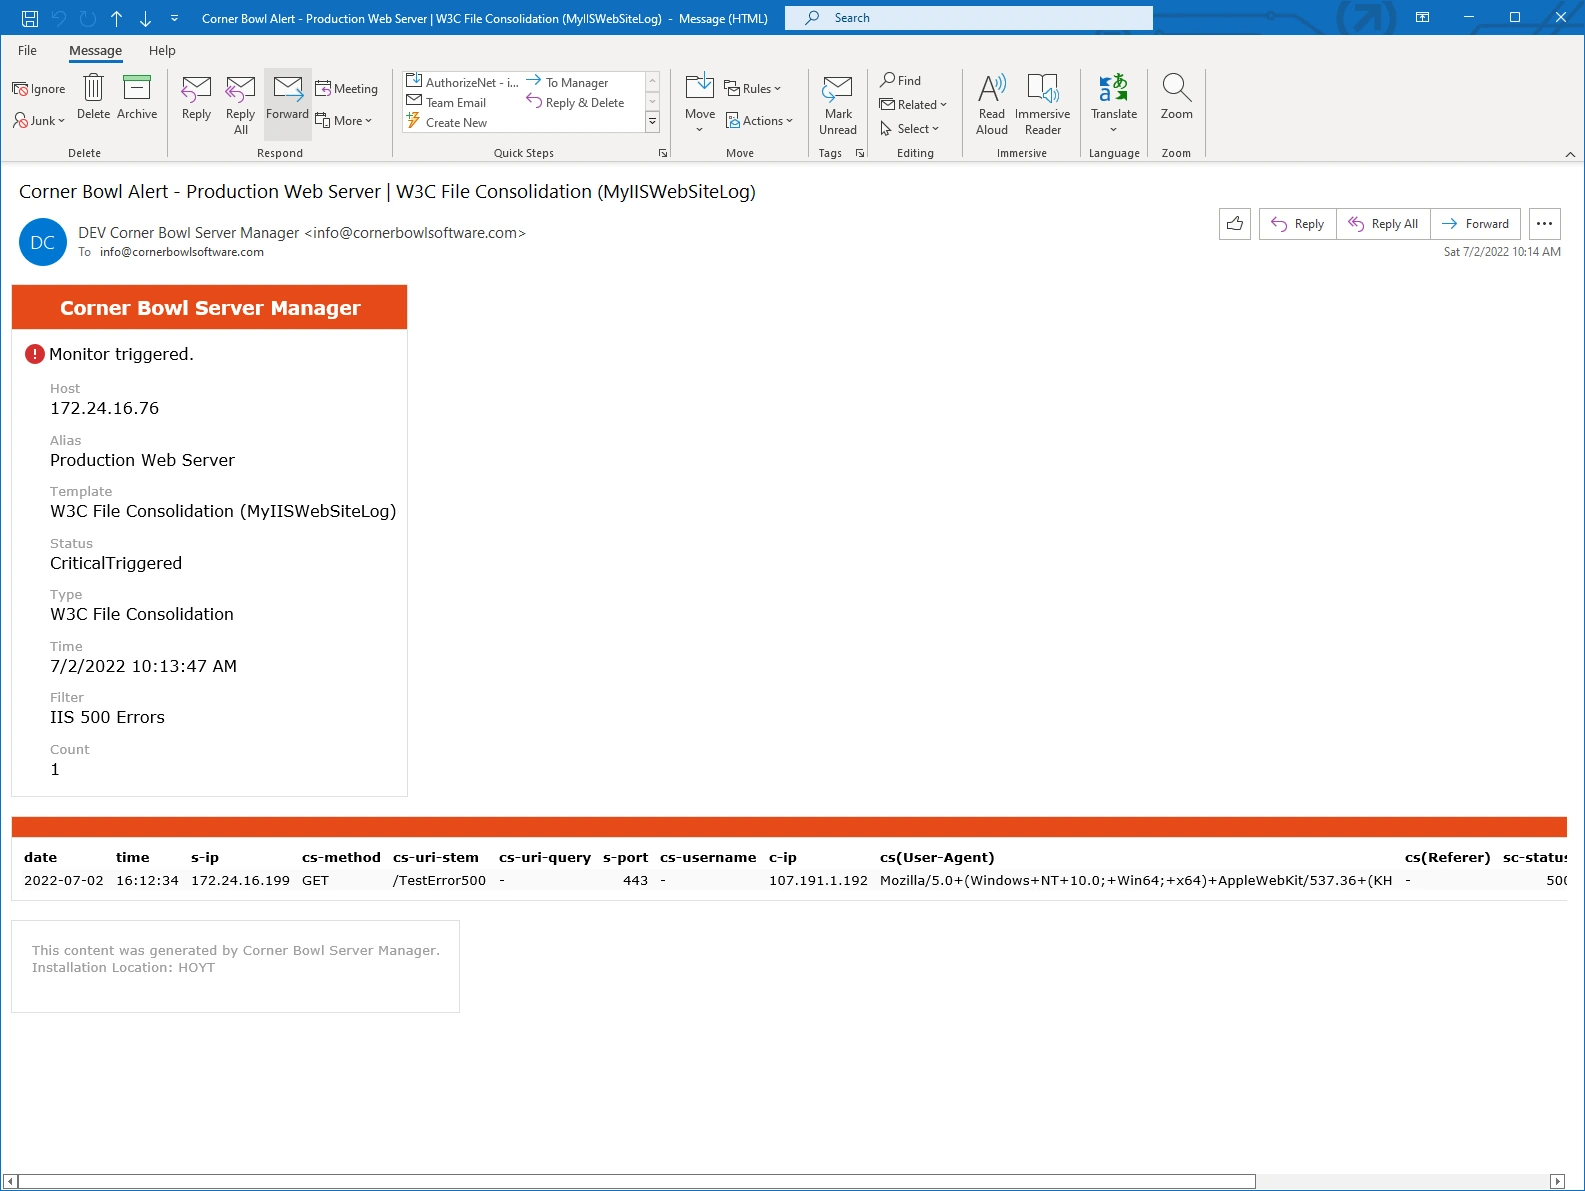
Expect to see the Server Manager trigger the monitor and send an email within one minute.
 IIS 500 Error Monitor Status View
 IIS 500 Error Email Notification
How to Limit Emailed Columns
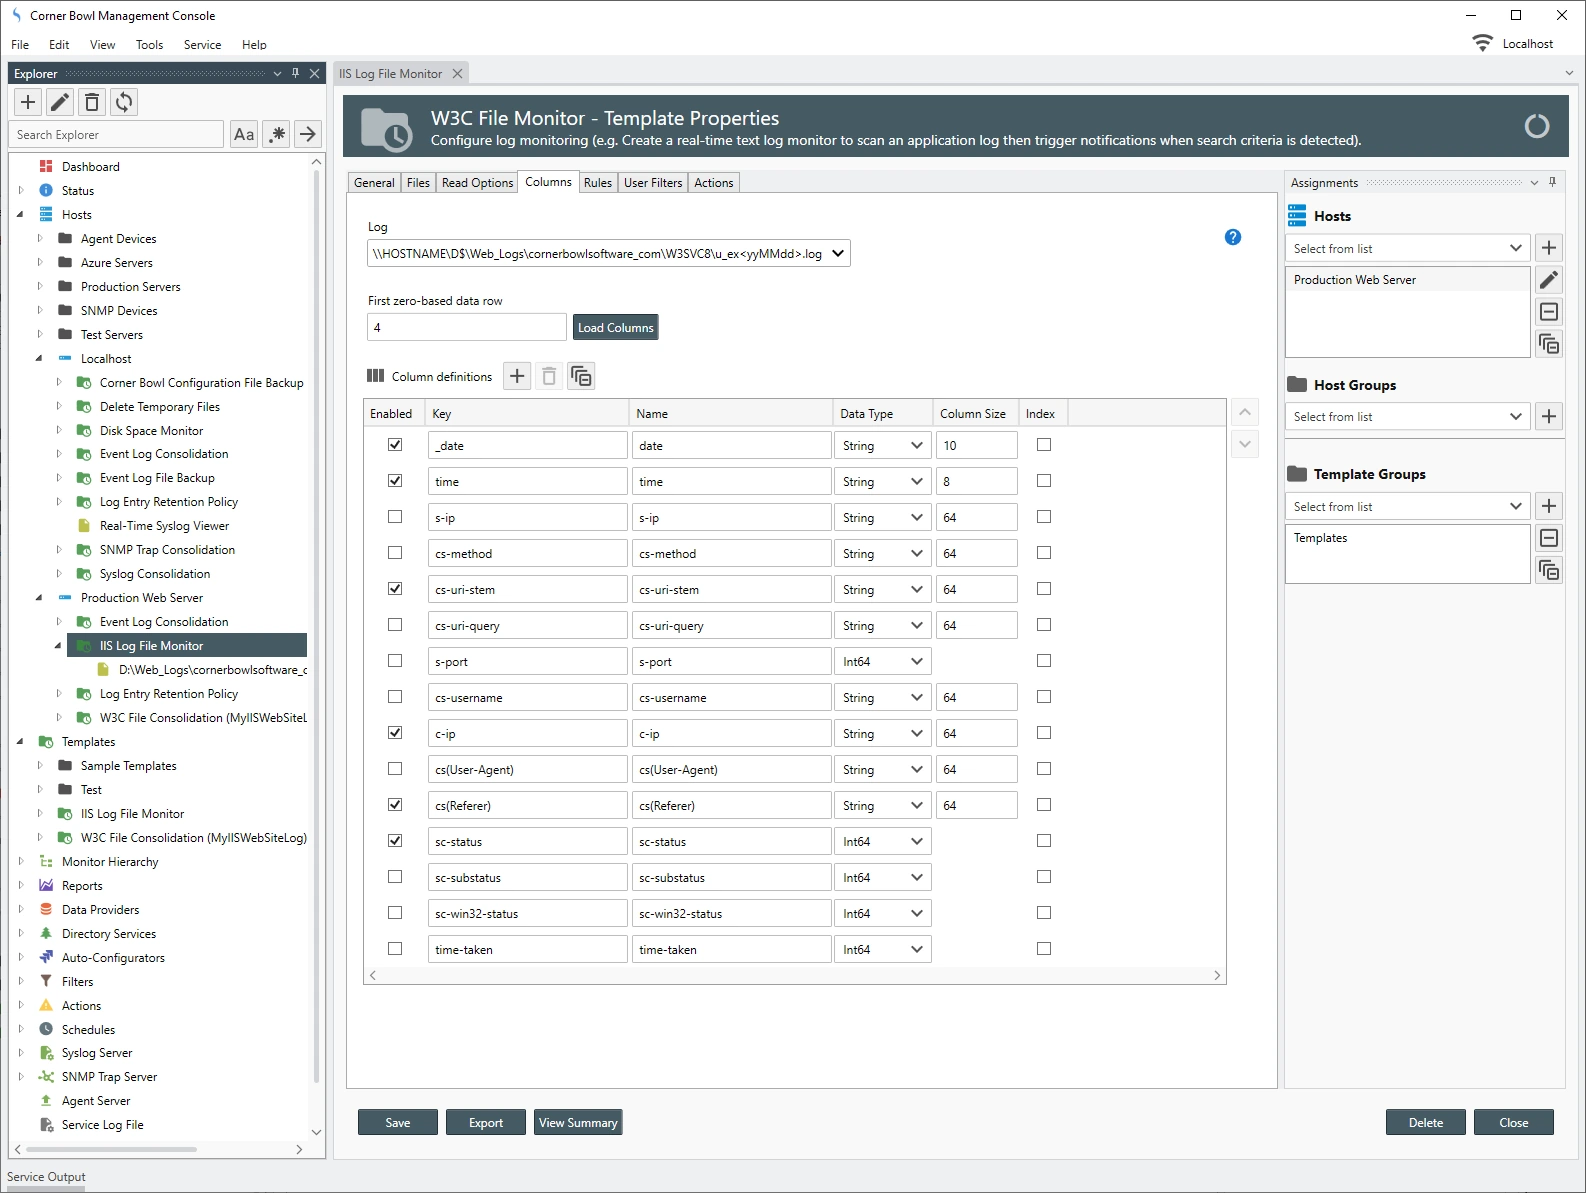
If you want to limit the columns returned in email notifications, you can instead create a W3C Log Monitor then, after defining the Columns, simply disable the columns which you would like to exclude from the email notification. To show you this in action, I paused the video and created an ISS Log File Monitor. Here's what it looks like.
- If I select the Columns Tab, we can see all of the columns just like we created for the IIS Log Consolidation template. De-select each enabled checkbox to remove the column form the email.
- Click Save to save your changes. Now, if I generate the error again, our email only includes the columns of interest.
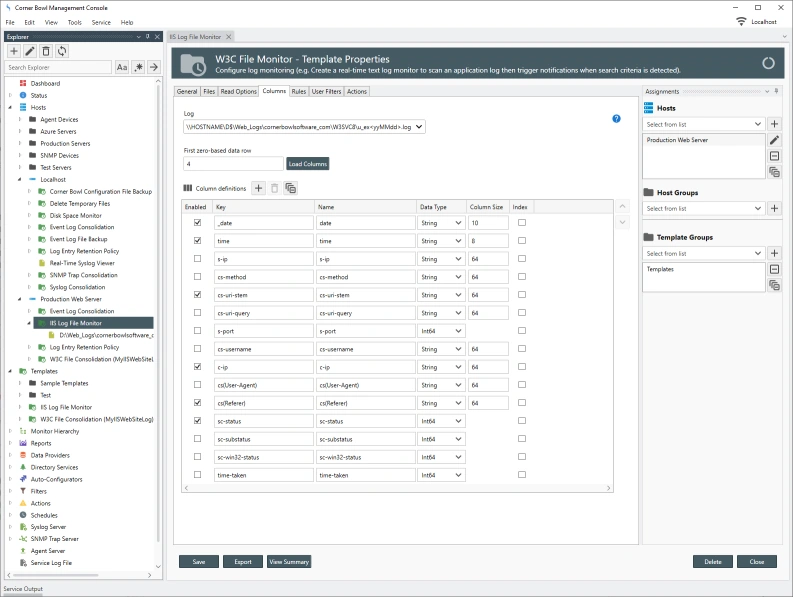 IIS Log Monitor Columns
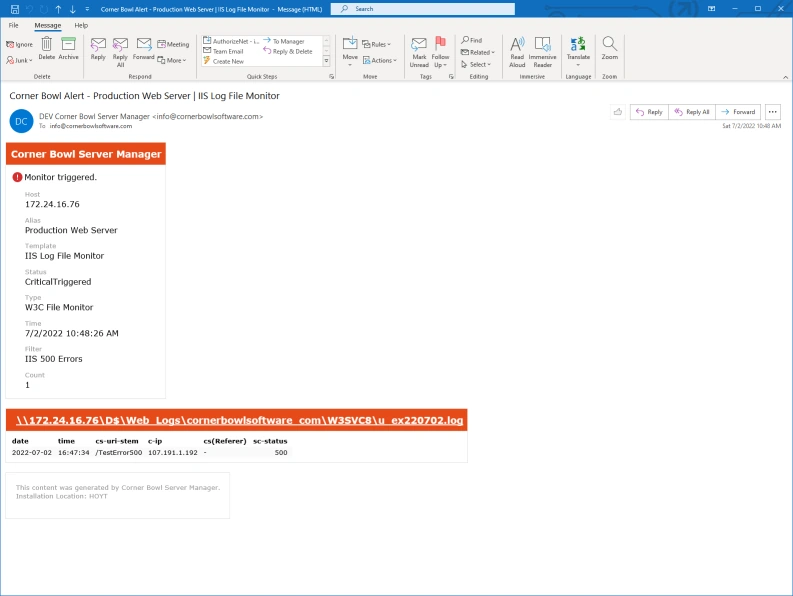 IIS 500 Error Email Notification with Specific Columns
 - That's part 2 of IIS Log Monitoring, Consolidation and Reporting with Corner Bowl Server Manager.