IIS Log Reporting, Monitoring and Consolidation (Part 3)
This is part 3 of a 3 part video set in which I will show you how to generate a daily report of HTTP 404 not found and 500 internal server errors generated from an IIS web server.
- In Part 1 I showed you how to save IIS log entries to a SQL Server database with table columns for each field.
- In Part 2 I showed you how to monitor IIS logs in real-time to get notified when there is a 500 error.
Table of Contents
How to Create a Report
First, we need to create the report.
- To create the Report, from the Menu Bar, select File | New. The Create New Object View displays.
- From the Create New Object View, expand Report, Log Consolidation Reports then select Text Log Report. The New Text Log Report Properties View displays.
-
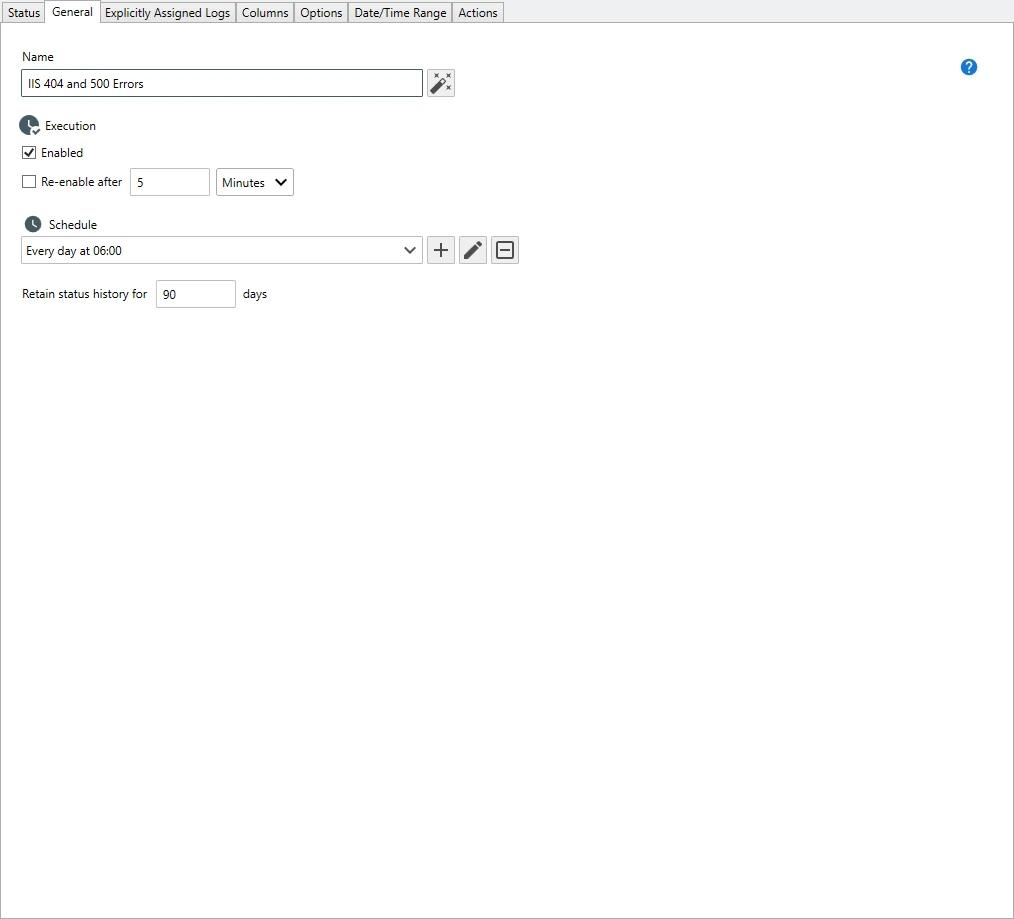
From the New Text Log Report Properties View, use the General Tab
to specify the report name and schedule to run the report. To create a daily
report for yesterday's data, select a daily schedule, for example, Every day
at 06:00.
 IIS Log Report General Properties
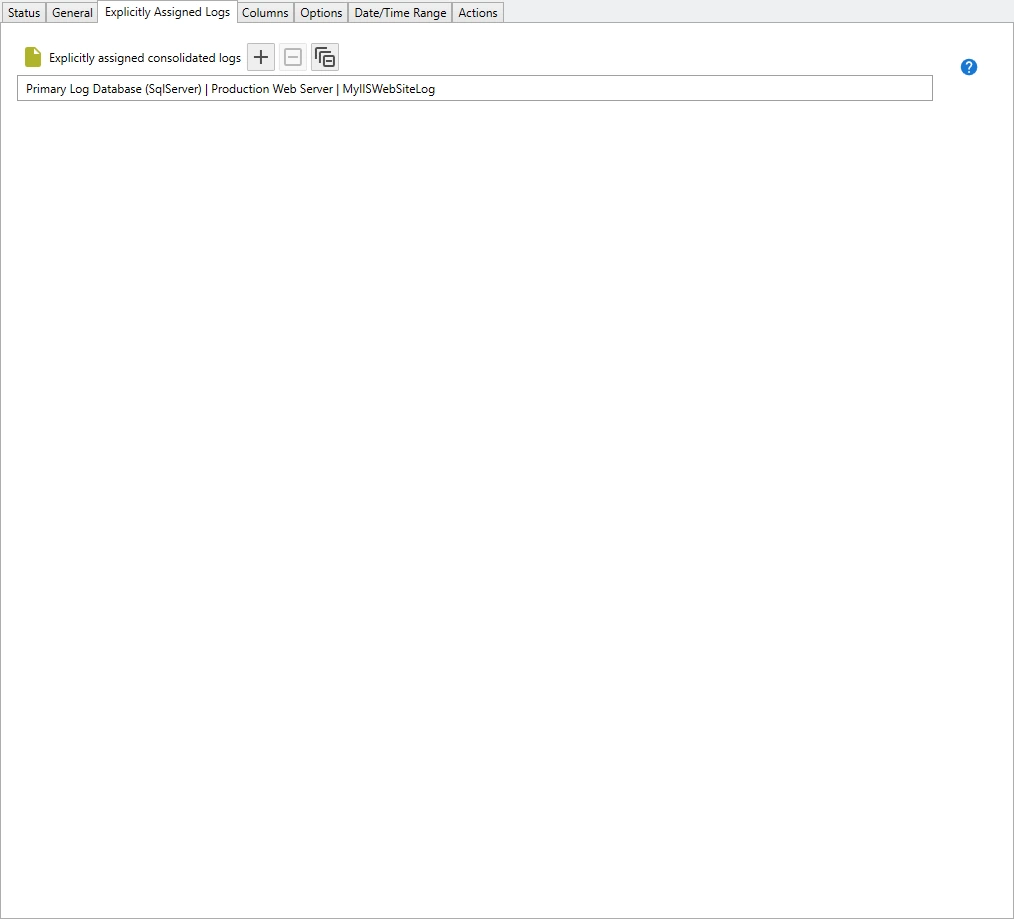
 - Use the Explicitly Assigned Logs Tab to assign the log you want to monitor. To assign the log, press the Add
 button. The Select Logs Dialog displays.
 -
From the Select Logs Dialog, expand your Primary Log Database,
navigate to the target host then expand. Check the MyIISWebSiteFile node
then click OK. The selected log is added to the list of explicitly
assigned consolidated logs.
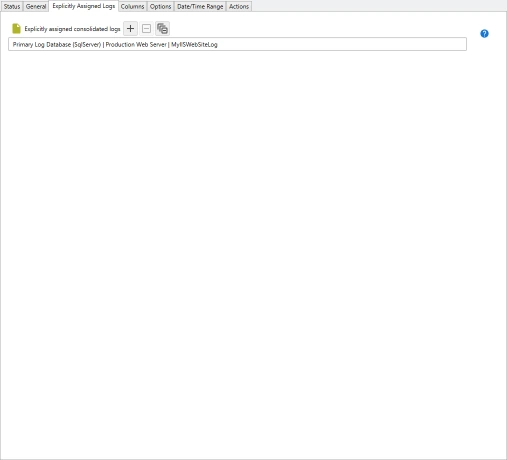 Assign Logs
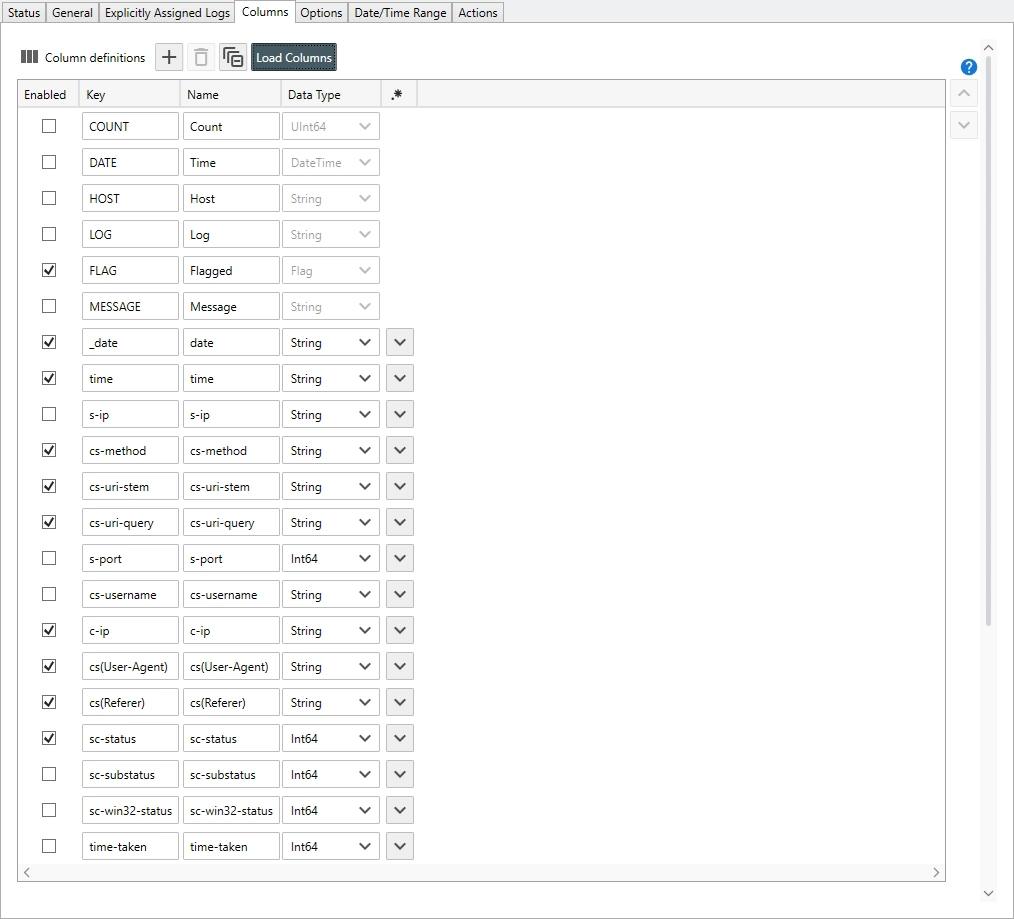
 - Use the Columns Tab to load the columns of interest into the report. To load the columns, click the Load Columns button. The column definitions found in the corresponding IIS Log Consolidation Template are loaded into the Column definitions list.
- Since we are going to display the columns in their native format, we can deselect the Date and Message columns.
-
Next, we can deselect the native columns we are not interested in. I am going to deselect several columns which do not provide me with any valuable information for this report. These are:
- s-ip
- s-port
- cs-username
- sc-substatus
- sc-win32-status
- time-taken
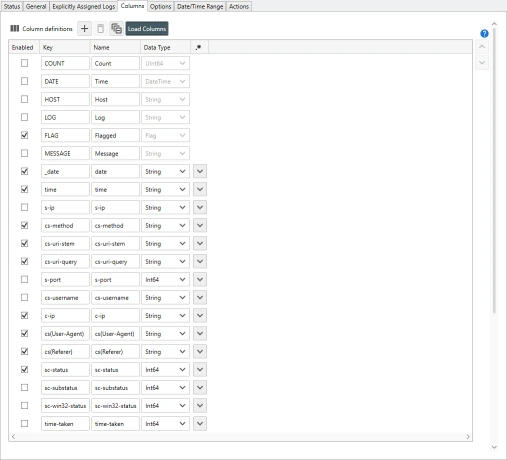 Assign Columns
 -
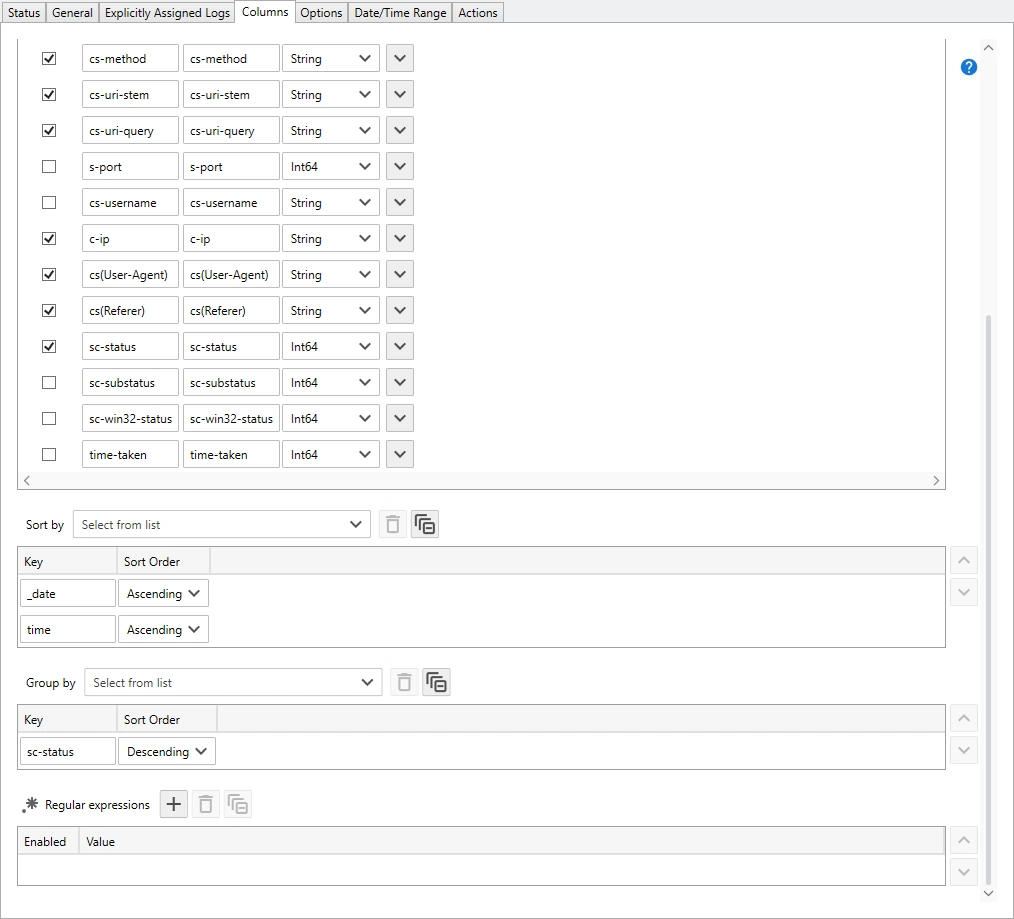
Since we disabled the internal consolidation DATE column, which is used
to sort the report content, we need to configure how to sort the report content.
Use the Sort by controls to configure sorting. If you are on a small
screen, you may need to scroll down to find the controls.
- Click the Clear
 button to clear the current sort rules.
 - Next, use the drop-down to select the IIS _date column then the IIS time column.
- Click the Clear
-
To create a report that contains a table for 404 errors and another table for
500 errors, use the Group by controls to set the column to group by.
From the Group by controls select to group by the sc-status then,
to see the table of 500 errors first, set the sort direction to Descending.
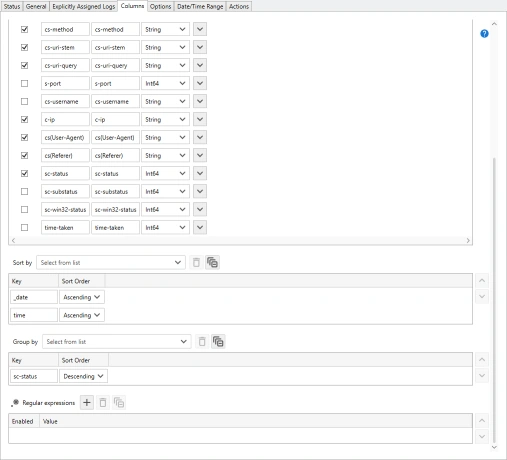 Assign Sort By and Group By Rules
 -
Use the Options Tab to assign your filters. Since we want to generate a
report of 404 and 500 responses, select the corresponding 404 and 500 filters.
If you have not already created a 404 filter, go ahead and create one now.
Since all we need to do is change the error code in our 500 IIS Errors filter,
we can simply duplicate that filter then modify and rename it to suit our needs.
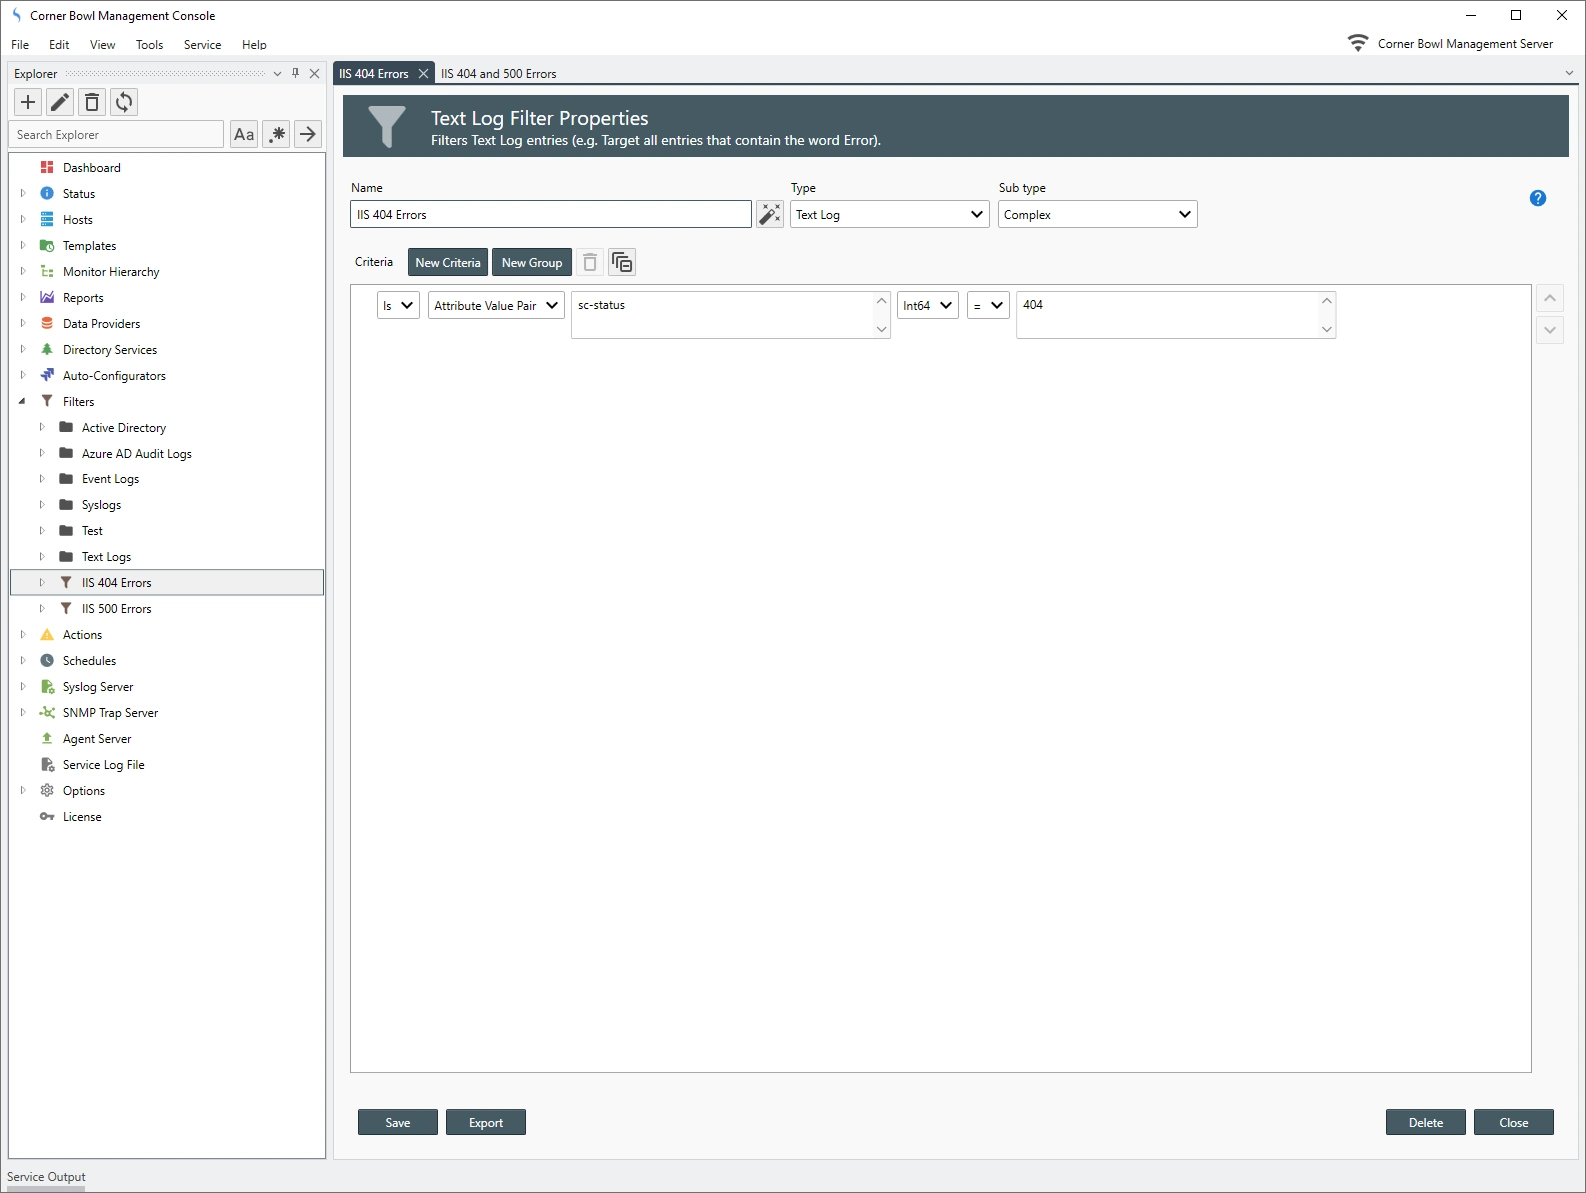
- From the Explorer View, find the IIS 500 Errors filter then either right click and select Copy then Paste or press Ctrl-C then Ctrl-V. Either way, the filter is copied to the same location. Right click on the new filter then select Properties. The Filter Properties View displays.
-
From the Filter Properties View, modify the both the name and criteria
to filter on IIS 404 errors then click Close. When prompted save your
changes.
 IIS 404 Not Found Filter Properties
-
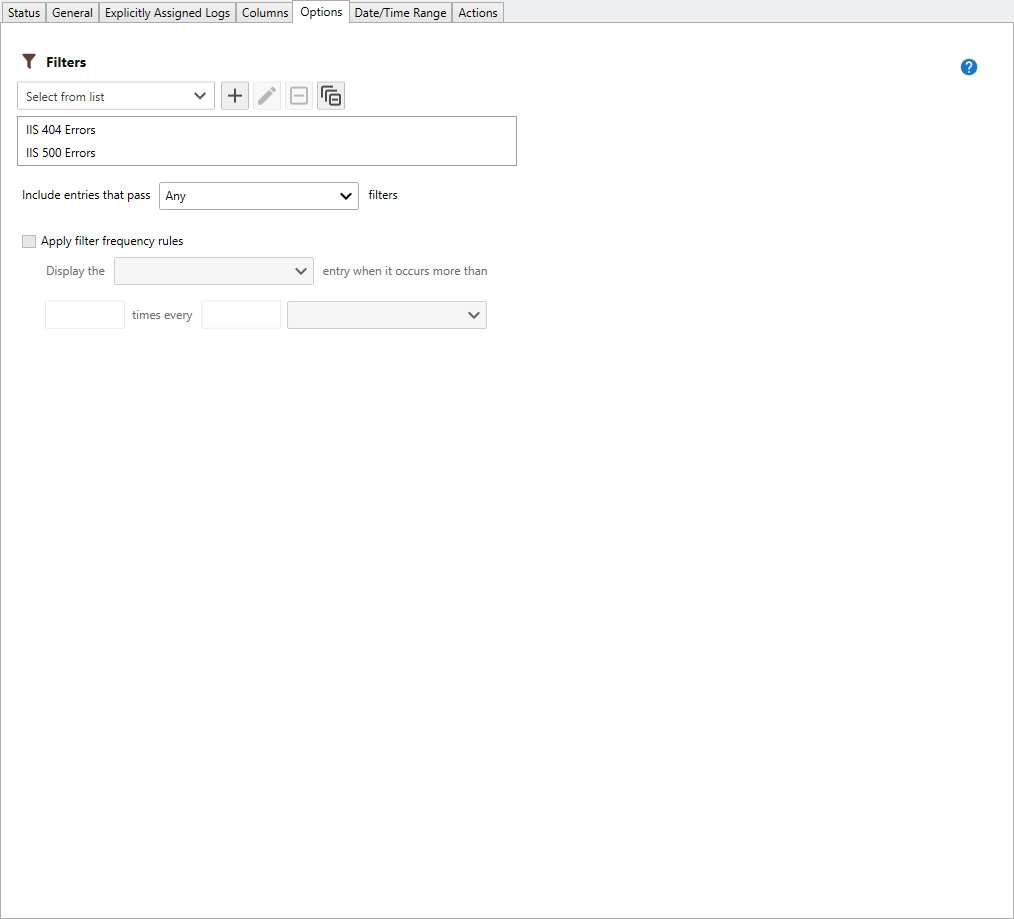
Back in the New Text Log Report Properties View, use the Filters
drop-down to select both the IIS 404 Errors and IIS 500 Errors
filters. Since we want this report to pass both 404 and 500 errors make sure the
Include entries that pass Any filters option is selected.
 Assign Filters
 -
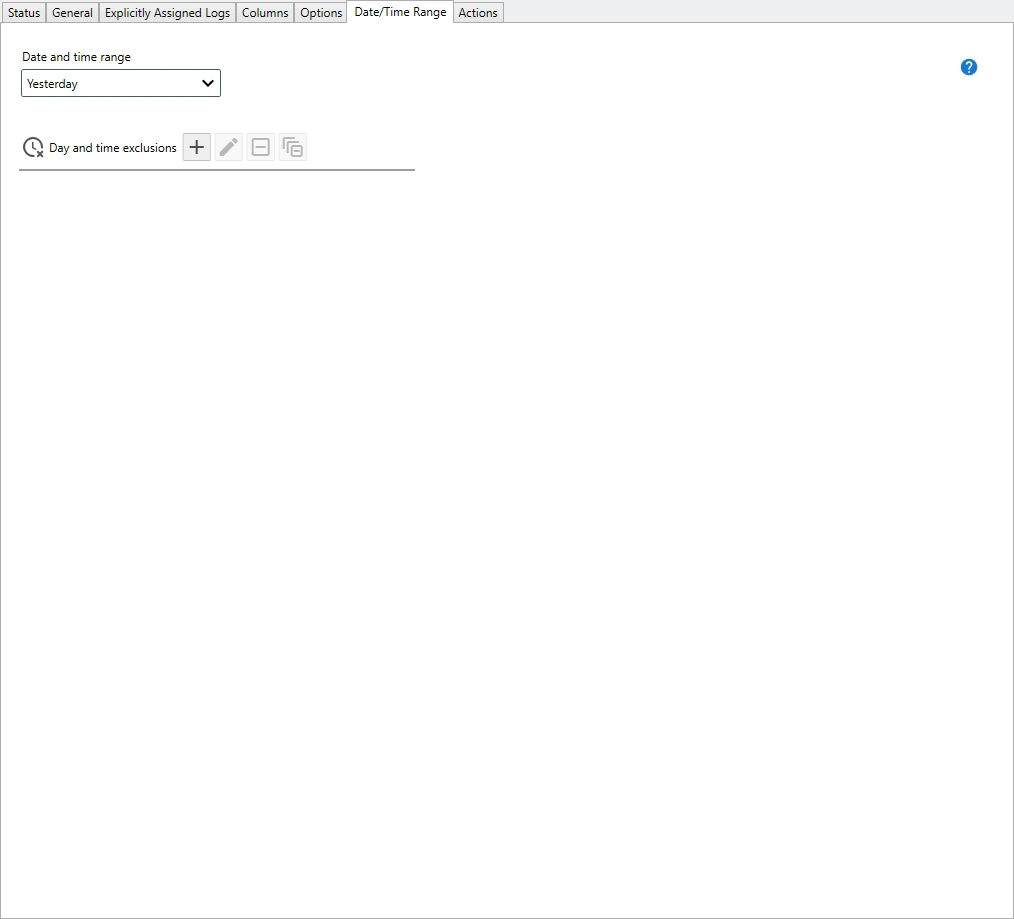
Use the Date/Time Range Tab to select the date range to include in this report. Since we are creating a report for yesterday, select Yesterday.
 Assign Date Range
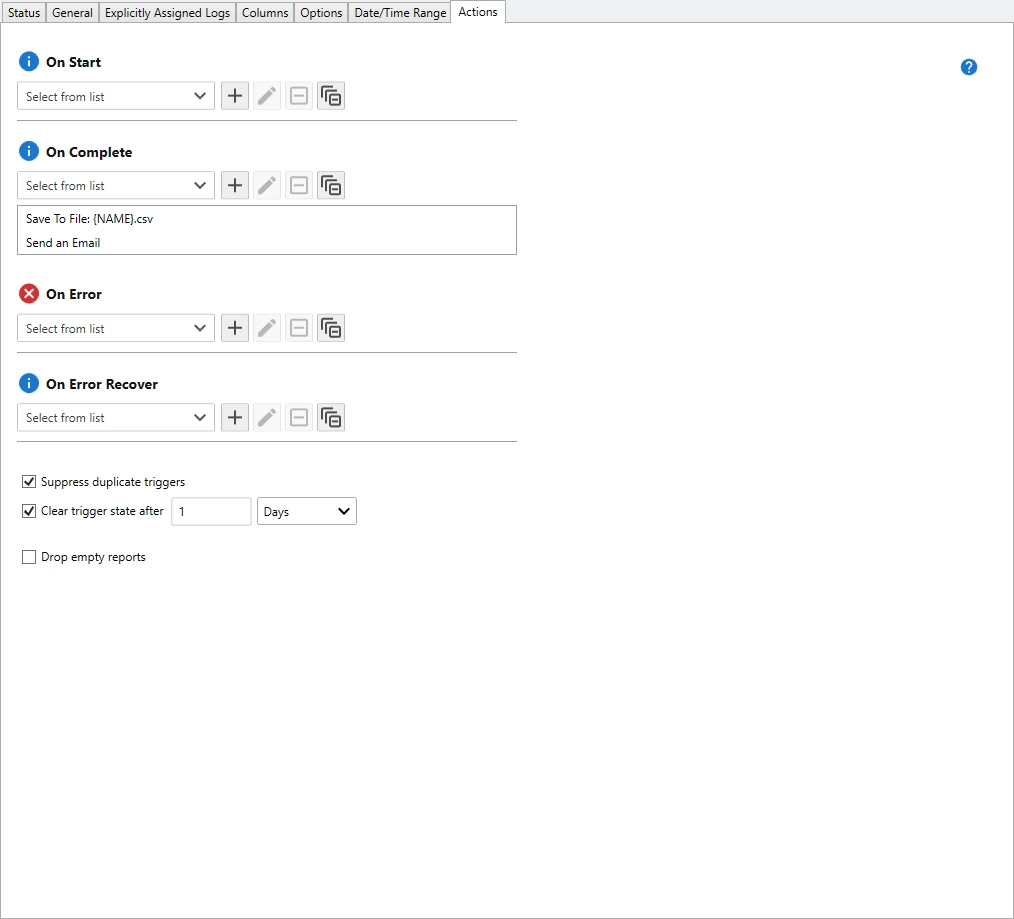
 - Use the Actions Tab to select the automated report output, for example Send an Email and Save to CSV.
NoteI chose to also include CSV that way I can send the report to the appropriate developers whom do not have access to this software or data. The CSV file enables them to open the file in Excel then mark off entries as they are completed.
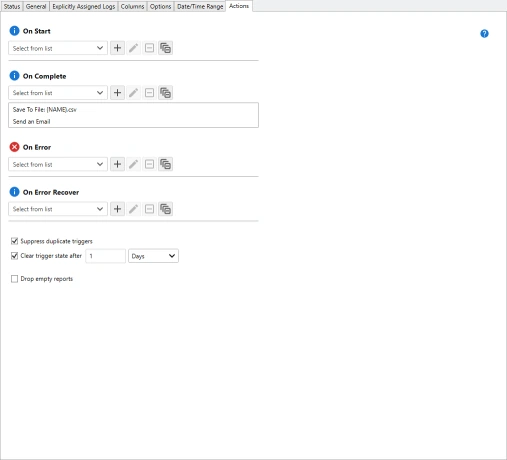 Assign Email and CSV Actions
 - Click Save to save your changes.
Viewing the Report
-
From the Report Properties View, click View Report. The IIS Log Report View displays then loads the relevant log entries.
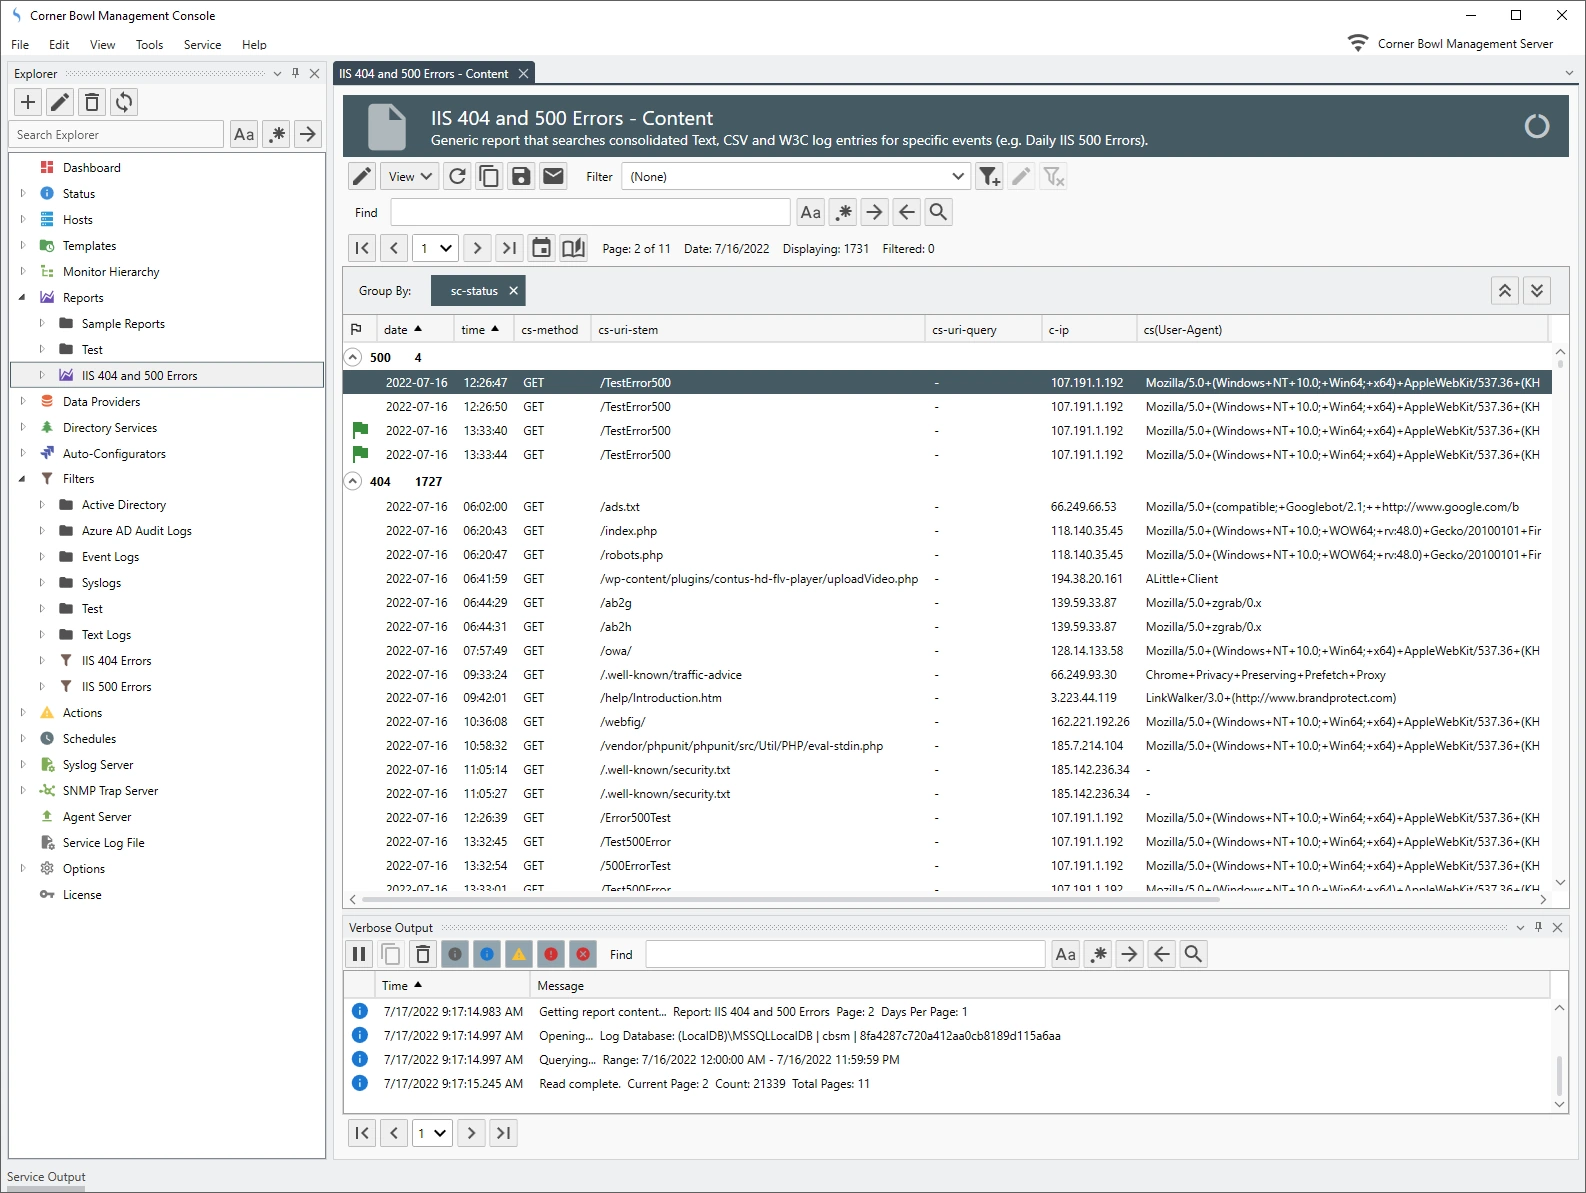
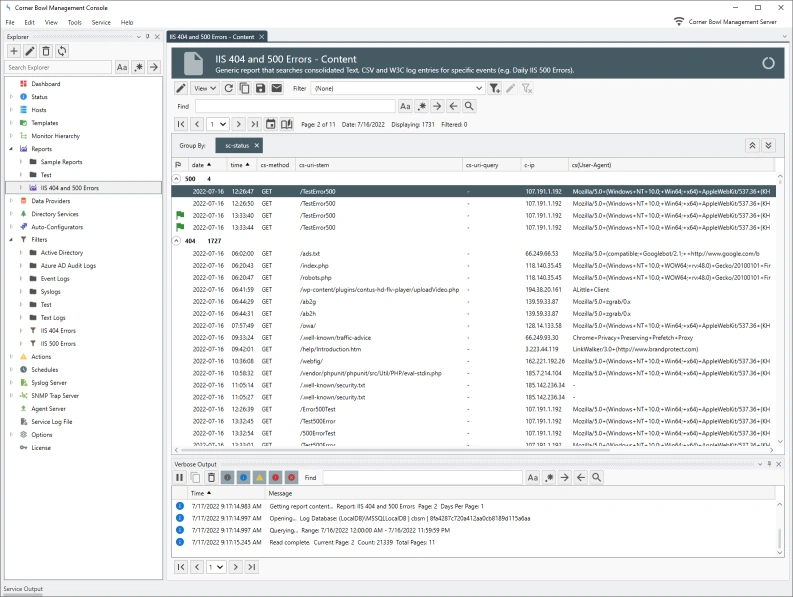 IIS 404 and 500 Errors ReportNoteNotice the sc-status column is grouped and sorted descending. When we expand the group, we can see each relevant entry.NoteAlso notice the Flag column. Use this column to mark entries for review then, later once each log entry is resolved, completed.
 -
To execute the Report so it automatically sends the email and generates the CSV
file, either wait for the schedule or from the Explorer View, find the
report then right click and select Execute. Once complete, we receive the
email notification and the CSV file is generated.
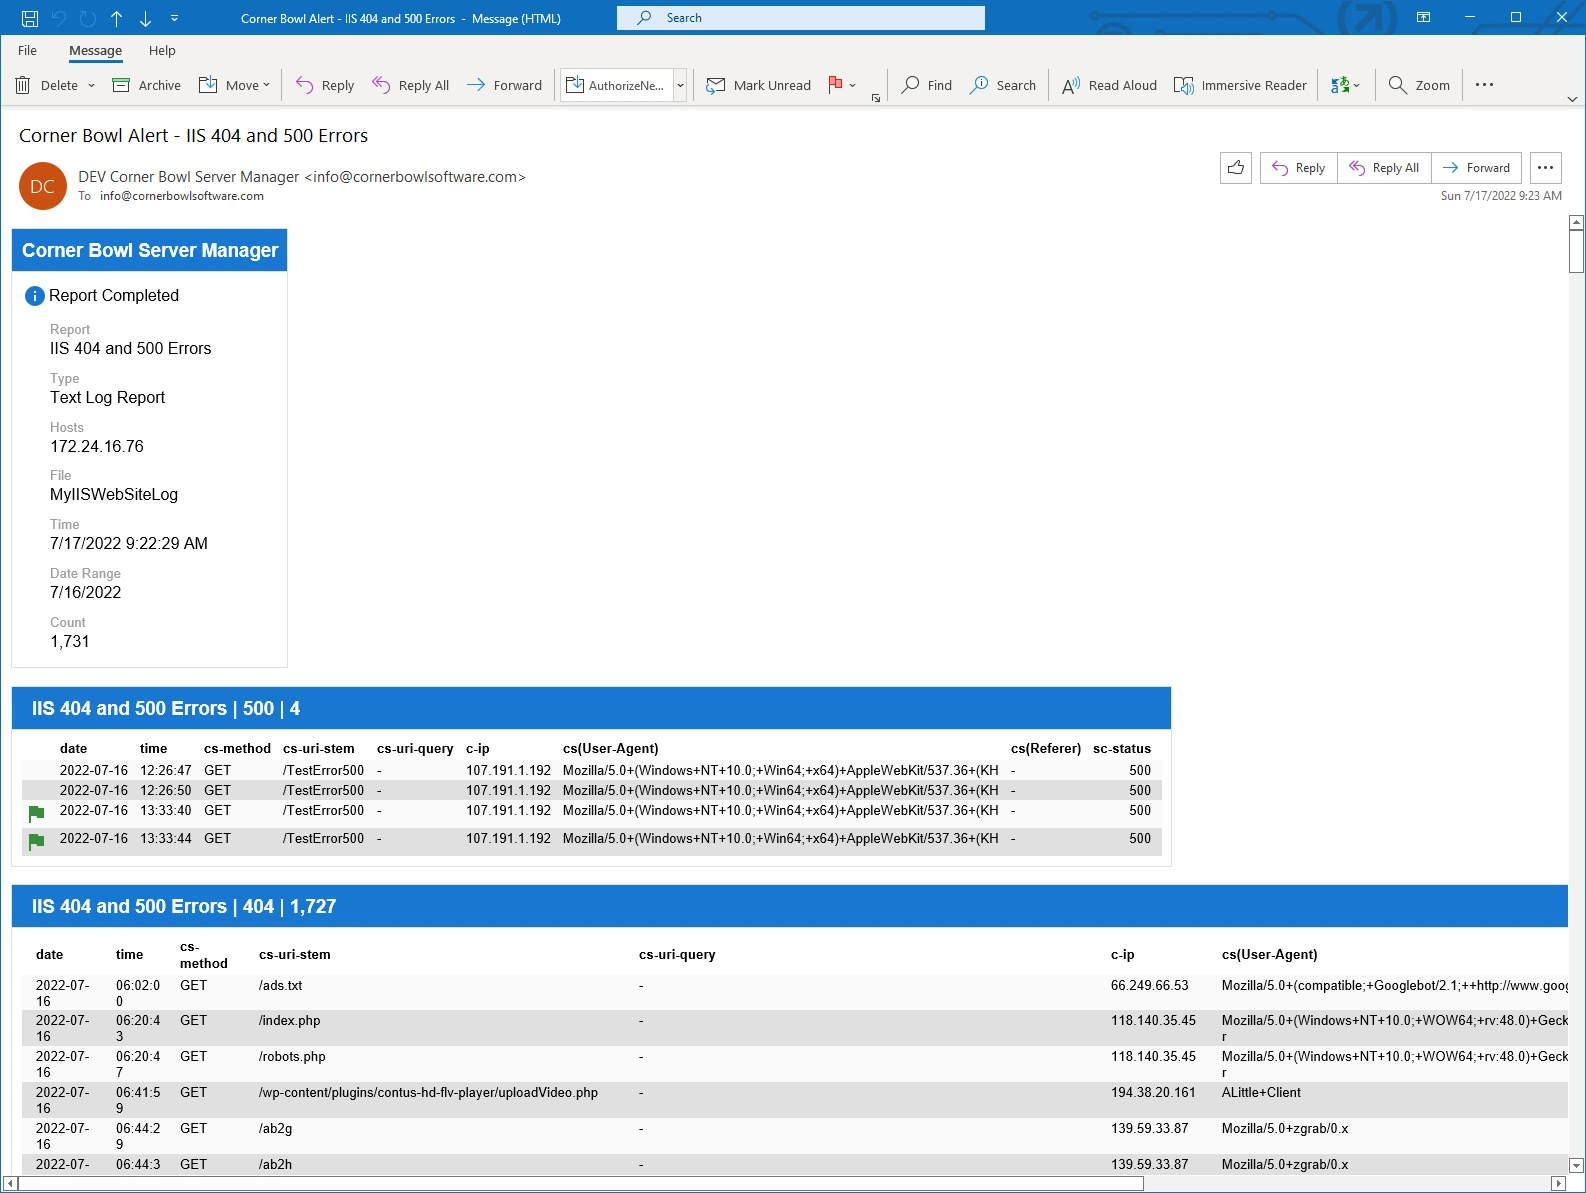
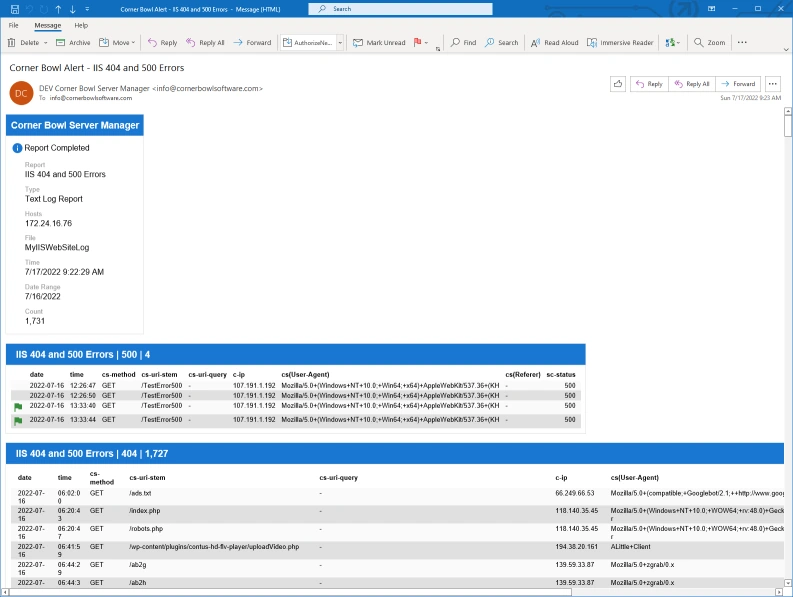 IIS 404 and 500 Errors Email Report
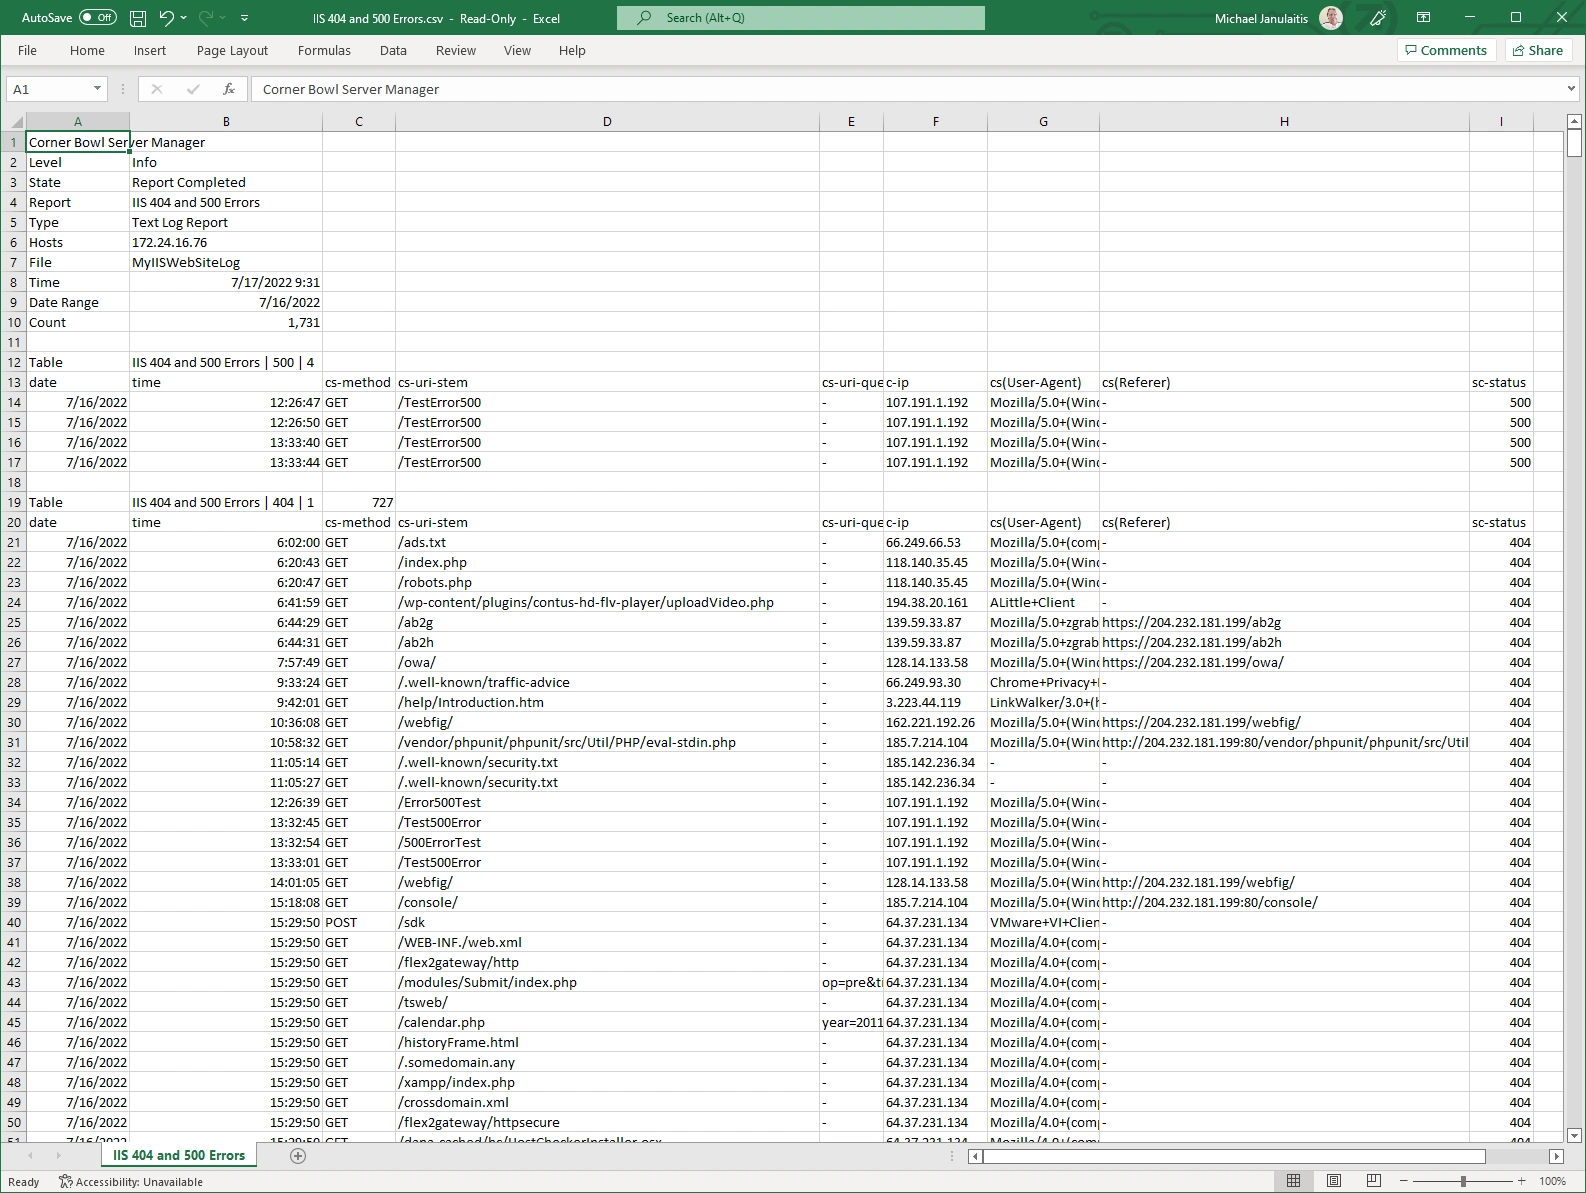
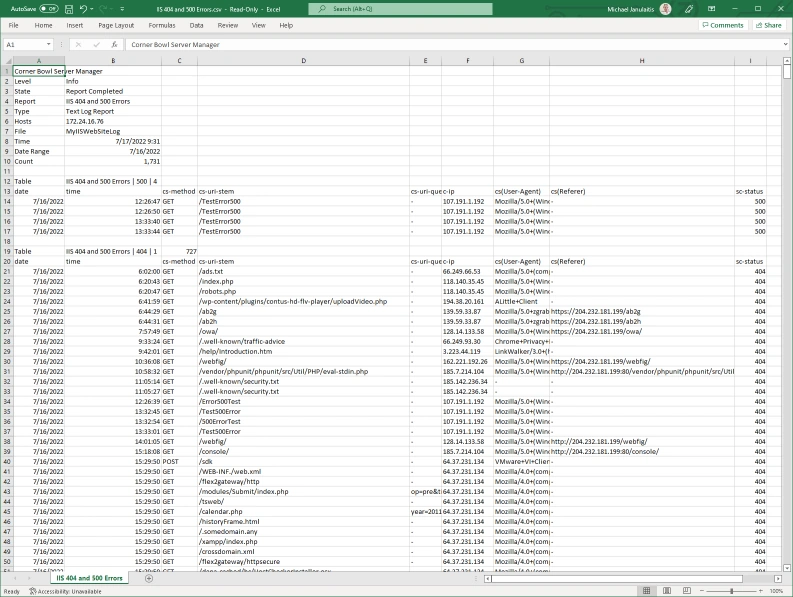 IIS 404 and 500 Errors CSV Report
Real-World Use Case
While I was generating this tutorial, I received a notification from another IIS Log File Size Monitor stating that our production web server IIS log file size had increased more than the expected amount between scans. That alert prompted me to investigate. I loaded and reviewed this report. I noticed our production web server was receiving a high volume of requests for invalid pages causing the web server to return 404 not found responses.
An active phishing attack was in process.
From the report, I cleared the Group by columns then grouped by the c-ip, the client's IP address. Once grouped, I was able to instantaneously see the attacker's IP address. I selected one of the IIS log entries, then pressed Ctrl-C to copy the entire IIS log entry to memory. Once copied, I pasted the entry to notepad, extracted the client's IP address, then logged into our firewall and blocked the attack. Problem solved!
That's part 3 of IIS Log Reporting, Monitoring and Consolidation.