Table of Contents
- Getting Started
- Agent-Based Management
- Common Tasks
- Data Providers
- Directory Services
- Auditing
- Hosts
- Templates
- Template Properties
- Batch Update Templates
- Assign Templates
- Log Management Templates
- SCAP Compliance Monitor
- Active Directory User Monitor Templates
- File and Directory Monitor Templates
- Windows Monitor Templates
- CPU Monitor Template
- Memory Monitor Template
- Disk Space Monitor Template
- Account Lockout Monitor Template
- Audit Policy Monitor Template
- Logon As Monitor Template
- Logon Monitor Template
- Performance Counter Monitor Template
- PowerShell Template
- Process Monitor Template
- RDP Session Monitor Template
- Registry Value Monitor Template
- Service Monitor Template
- SMART Disk Monitor Template
- System Security Monitor Template
- Windows Update Template
- WMI Query Template
- Task Scheduler Template
- Clock Synchronization Template
- Defragment NTFS Disks Template
- Network and Application Monitor Templates
- SSL Certificate Monitor Templates
- Database Templates
- Email Monitor Templates
- SNMP Monitor Templates
- Windows Accounts Templates
- Monitors
- Reports
- Auto-Configurators
- Filters
- Actions
- Schedules
- Environment Variables
- Options
- SNMP
- SSH Shell
- Syslog
- System Reset
- Shared Views
- Active Directory User and Group Filters
- Assign Actions
- Assign Azure Audit Logs
- Assign Consolidated Logs
- Assign Directories
- Assign Disks
- Assign Event Logs
- Assign Files
- Assign Services
- Assign Shares
- Auto-Config Host Assignment Properties
- Define CSV and W3C Log Entry Columns
- Define Log Entry Columns
- Define Log Entry Columns with Regular Expressions
- Executable Status
- Executable Timeline
- Explicitly Assigned Logs
- File Explorer
- General Executable Properties
- Report Columns
- Report Date/Time Ranges
- Report Security Event Log Filters
- Select Folder or File
- Target Files and Sub-Directories
- Command Line Interface
- Server Configuration
- Agent Configuration
- Troubleshooting
- Best Practices
- Terminology
Executable Status
The Executable Status View is displayed when you Explore a Template that is listed under a Host (aka a Monitor, Function or Task), a Report and an Auto-Configurator. This view displays several items enabling you to review the current status, history and verbose output while the component is executing.
Schedule Status
The Schedule Status is displayed at the top and includes an image depicting the state of the component, last executed at, next scheduled execution time and last time the component was triggered.
Available States
| State | Description | |
|---|---|---|
| OK | The normal untriggered state. | |
| Warning Trigger | Displayed when the component has noticeably triggered. | |
| Critical Trigger | Displayed when the component has critically triggered. | |
| Errored | Displayed when the component has errored. | |
| Template Running | Displayed when a Template executes, a Template is assigned a real-time schedule or schedule that executes faster than once a minute. | |
| Template Stopped | Displayed when a Template is manually canceled, while being restarted or the assigned schedule exclusion period is triggered. | |
| Disabled | Component has been either permanently or temporally disabled. |

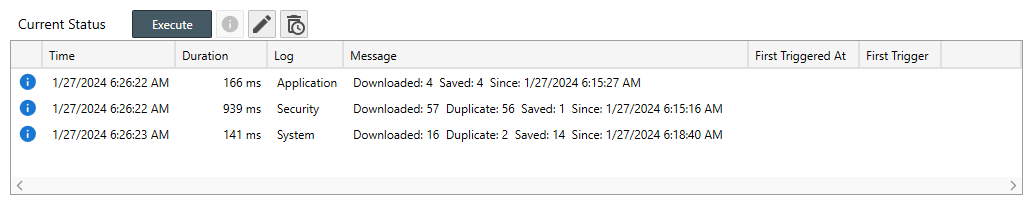
Current Status
The Current Status View is found in the middle of the view. This view lists the current status. If, for example, you are consolidating multiple Event Logs, each log and corresponding status is listed in this view. You have the option to manually execute the component, clear the triggered state and reset the component's state.
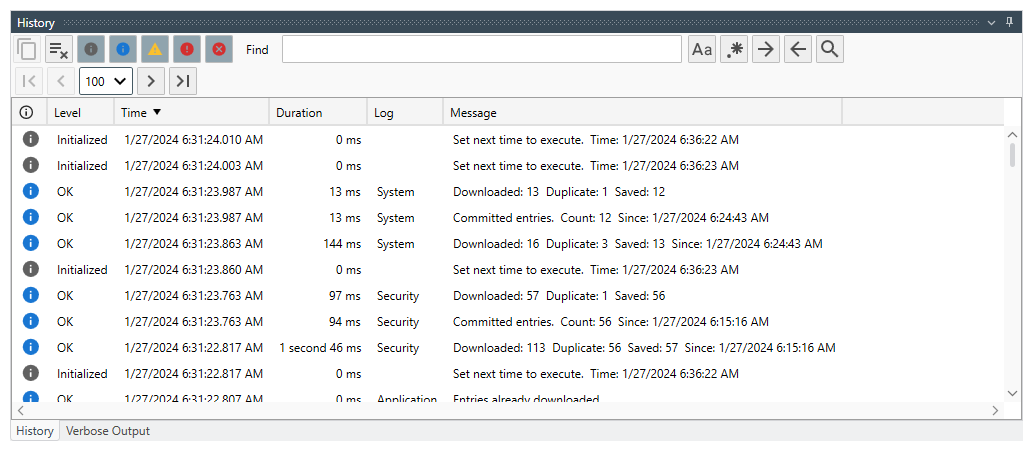
History
The History View can be found in a tab at the bottom of this view. This view lists historical events such as, next scheduled execution time, execution results and executed actions are saved to the History Database. This view includes options to clear the history, filter out different message levels, find specific strings, and page through large amounts of results.
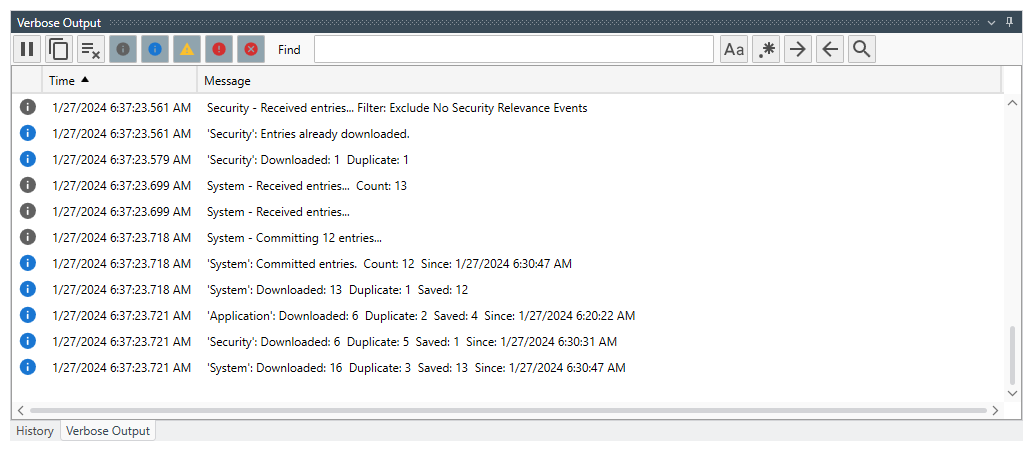
Verbose Output
The Verbose Output View can be found in a tab at the bottom of this view. When component executes, verbose details is printed out to this data table enabling you to monitor and troubleshoot component execution.