Table of Contents
- Getting Started
- Agent-Based Management
- Common Tasks
- Data Providers
- Directory Services
- Auditing
- Hosts
- Templates
- Template Properties
- Batch Update Templates
- Assign Templates
- Log Management Templates
- SCAP Compliance Monitor
- Active Directory User Monitor Templates
- File and Directory Monitor Templates
- Windows Monitor Templates
- CPU Monitor Template
- Memory Monitor Template
- Disk Space Monitor Template
- Account Lockout Monitor Template
- Audit Policy Monitor Template
- Logon As Monitor Template
- Logon Monitor Template
- Performance Counter Monitor Template
- PowerShell Template
- Process Monitor Template
- RDP Session Monitor Template
- Registry Value Monitor Template
- Service Monitor Template
- SMART Disk Monitor Template
- System Security Monitor Template
- Windows Update Template
- WMI Query Template
- Task Scheduler Template
- Clock Synchronization Template
- Defragment NTFS Disks Template
- Network and Application Monitor Templates
- SSL Certificate Monitor Templates
- Database Templates
- Email Monitor Templates
- SNMP Monitor Templates
- Windows Accounts Templates
- Monitors
- Reports
- Auto-Configurators
- Filters
- Actions
- Schedules
- Environment Variables
- Options
- SNMP
- SSH Shell
- Syslog
- System Reset
- Shared Views
- Active Directory User and Group Filters
- Assign Actions
- Assign Azure Audit Logs
- Assign Consolidated Logs
- Assign Directories
- Assign Disks
- Assign Event Logs
- Assign Files
- Assign Services
- Assign Shares
- Auto-Config Host Assignment Properties
- Define CSV and W3C Log Entry Columns
- Define Log Entry Columns
- Define Log Entry Columns with Regular Expressions
- Executable Status
- Executable Timeline
- Explicitly Assigned Logs
- File Explorer
- General Executable Properties
- Report Columns
- Report Date/Time Ranges
- Report Security Event Log Filters
- Select Folder or File
- Target Files and Sub-Directories
- Command Line Interface
- Server Configuration
- Agent Configuration
- Troubleshooting
- Best Practices
- Terminology
Corner Bowl Server Manager
SIEM, IPS, Server Monitoring, Uptime Monitoring and Compliance Software
SSH Monitor Template
The SSH Monitor Template enables you to check the availability of an SSH server, run SSH shell scripts, parse results and trigger actions. This template is typically used by systems administrators to tar Linux Audit Log files and monitor resources such as monitor CPU, disk space and memory on Linux servers.
Important
SSH server connection parameters as set via the Host Properties | SFTP Tab.
For more information see: SFTP Properties
For more information see: SFTP Properties
How to configure the SSH Moniotr Template:
- From the Menu Bar, select File | New. The Create New Object View displays.
- From the Create New Object View, expand Templates | Network and Application Monitors then select SSH Monitor. The New Template Properties View displays.
- The Template Properties view contains 3 tabs.
The Options Tab
- Use the Host drop-down to select the server you would like to monitor.
Note
Once selected, the server is automatically assigned to this template.
- Use the Terminal name text box to specify the terminal name (e.g. xterm or VT100).
- Use the Columns text box to specify the terminal width in columns.
- Use the Rows text box to specify the terminal height in rows.
- Use the Width text box to specify the terminal width in pixels.
- Use the Height text box to specify the terminal height in pixels.
- Use the Buffer size text box to specify the buffer size.
- Use the Timeout text box to specify the time to wait for the command-prompt.
- Use the Commands controls to specify each command to execute.
- Use the Command text box to specify the command to execute (e.g. tar -cvf AuditLogs.tar /etc/security/audit_event).
- Use the Response text box to specify the answer to a command's question (e.g. your password).
Note
Response values are encrypted using FIPS compliant AES encryption.
- Use the Timeout text box to specify the time to wait for the command-prompt after each command and response.
- Use the Up
 and Down
  buttons to change the order of commands.
 - Use the Execute
 button to run the commands and view the results.
- Use the Is tabular check box to parse tabular results.
Tabular Results
Use the Column definitions control to automatically define the results schema.
- Click the Load Columns button to run the script then automatically generate the column definitions.
- Use the Key text box to specify a unique key to be used by filters.
- Use the Name text box to specify the column header's display string.
- Use the Data Type drop-down to select the data type to assign to the column.
Other Results
Use the Column definitions control to manually define the results schema.
- Click the Add
 button. A new empty column definition is created at the bottom of the list.
 - Use the Key text box to specify a unique key to be used by filters.
- Use the Name text box to specify the column header's display string.
- Use the Data Type drop-down to select the data type to assign to the column.
- From the RegEx column, click the Down button to display the Regular expressions control.
- From the Regular expressions control, click the Add . A new Regular expression is added to the bottom of the list.
- Use the Value text box to specify the regular expression that defines a key value pair.
Important
To successfully validate, a regular expression variable must be defined that matches the key. For example, if the key is TARGET_ACCOUNT_NAME, there must be a corresponding variable ?<TARGET_ACCOUNT_NAME>The regular expression is validated against the current column key after you tab out of the text box or move focus to another control.
- Use the Up and Down buttons to change the regular expression order of execution.
- Use the Up
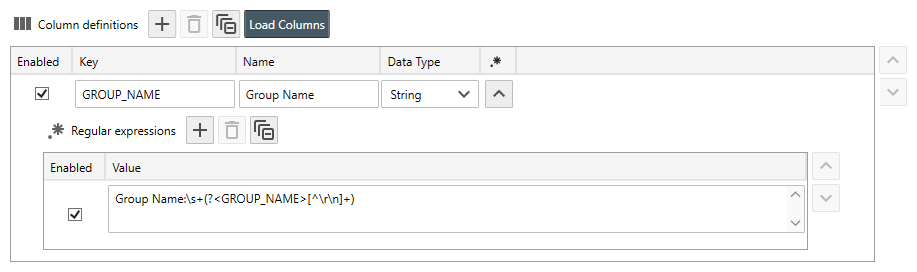
Sample Regular Expression Definition Properties View
Sort By:
- Use the Select from list drop-down to select an alternate column to sort by when the values in the prior column are identical. You can sort by as many columns as necessary to get the desired results.
- Use the Sort Order column drop-downs to assign the sort directions.
- Use the Up and Down buttons found on the right side of the table control to change the order of sorting.
- To delete an item, either select a single line item or use the shift and/or ctrl keys to multi-select, then either press the Delete key or press the Delete
 button.
 - To clear all listed items, press the Clear
 button.
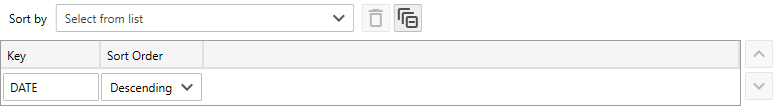
Sample Sort by Properties View
Group By:
- Use the Select from list drop-down to select each column to group by.
Note
When reports are emailed or saved to a file, a table is generated for each unique set of Group By columns.
- Use the Sort Order column drop-downs to assign the sort directions.
- Use the Sort By Count column checkbox to sort the groups by the count of rows rather than the names.
- Use the Up and Down buttons found on the right side of the table control to change the order of grouping.
- To delete an item, either select a single line item or use the shift and/or ctrl keys multi-select, then either press the Delete key or press the Delete button.
- To clear all listed items, press the Clear button.
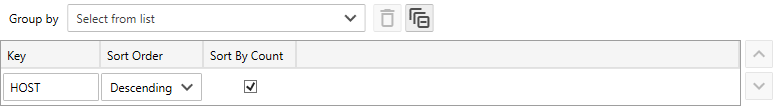
Group by properties
- Use the Warning and Critical Trigger controls to apply trigger criteria.
- Click the Test button to verify the template is configured property and the monitor executes as expected.
- Finally, select the General Tab, then click the click the Auto-Generate Name
 button to auto-generate a name based on the configured settings.