Table of Contents
- Getting Started
- Agent-Based Management
- Common Tasks
- Data Providers
- Directory Services
- Auditing
- Hosts
- Templates
- Template Properties
- Batch Update Templates
- Assign Templates
- Log Management Templates
- SCAP Compliance Monitor
- Active Directory User Monitor Templates
- File and Directory Monitor Templates
- Windows Monitor Templates
- CPU Monitor Template
- Memory Monitor Template
- Disk Space Monitor Template
- Account Lockout Monitor Template
- Audit Policy Monitor Template
- Logon As Monitor Template
- Logon Monitor Template
- Performance Counter Monitor Template
- PowerShell Template
- Process Monitor Template
- RDP Session Monitor Template
- Registry Value Monitor Template
- Service Monitor Template
- SMART Disk Monitor Template
- System Security Monitor Template
- Windows Update Template
- WMI Query Template
- Task Scheduler Template
- Clock Synchronization Template
- Defragment NTFS Disks Template
- Network and Application Monitor Templates
- SSL Certificate Monitor Templates
- Database Templates
- Email Monitor Templates
- SNMP Monitor Templates
- Windows Accounts Templates
- Monitors
- Reports
- Auto-Configurators
- Filters
- Actions
- Schedules
- Environment Variables
- Options
- SNMP
- SSH Shell
- Syslog
- System Reset
- Shared Views
- Active Directory User and Group Filters
- Assign Actions
- Assign Azure Audit Logs
- Assign Consolidated Logs
- Assign Directories
- Assign Disks
- Assign Event Logs
- Assign Files
- Assign Services
- Assign Shares
- Auto-Config Host Assignment Properties
- Define CSV and W3C Log Entry Columns
- Define Log Entry Columns
- Define Log Entry Columns with Regular Expressions
- Executable Status
- Executable Timeline
- Explicitly Assigned Logs
- File Explorer
- General Executable Properties
- Report Columns
- Report Date/Time Ranges
- Report Security Event Log Filters
- Select Folder or File
- Target Files and Sub-Directories
- Command Line Interface
- Server Configuration
- Agent Configuration
- Troubleshooting
- Best Practices
- Terminology
Corner Bowl Server Manager
SIEM, IPS, Server Monitoring, Uptime Monitoring and Compliance Software
AI Anomaly Detection Reports
AI Anomaly Detection Reports enable you to scan consolidated logs for User and Entity Behavior Analytics (UEBA) (e.g. Flag users that logon outside of their typical working hours). This report is typically used by network administrators that want to scan the archive log database for UEBA anomalies.
How to create an Artificial Intelligence Report
- From the Menu Bar select File | New. The Create New Object View displays.
- From the Create New Object View, expand Reports.
- Expand Report | Artificial Intelligence Reports then select one of the AI Anomaly Detection Reports. The Properties View displays.
- The Properties View contains either 7 or 8 configuration tabs depending on the report type selected.
- General
- Logs (Event Logs), Logs (Azure Audit Logs)
- Explicitly Assigned Logs (Log-Based Reports)
- Columns
- Options
- User Filters
- Date/Time Range
- Actions
The Columns Tab
Use this view to configure the columns to check for anomalies. This Tab is not available when creating Template Trigger AI Anomoaly Detection Reports.
- Use the Column definitions controls to add the columns you would like to check for anomalies. If the column is not extracted during log consolidation, add the column then specify the regular expression to extract the attribute's value.'
- Use the Group by drop-down to group entries into their own tables.
- Use the Regular expressions controls to specify the regular expressions to extract attribute values.
- Use the Select distinct count drop-down to specify the required column to check for anomalies. ImportantThis field is required.
- Use the Query by controls to optimize the SQL WHERE statements.
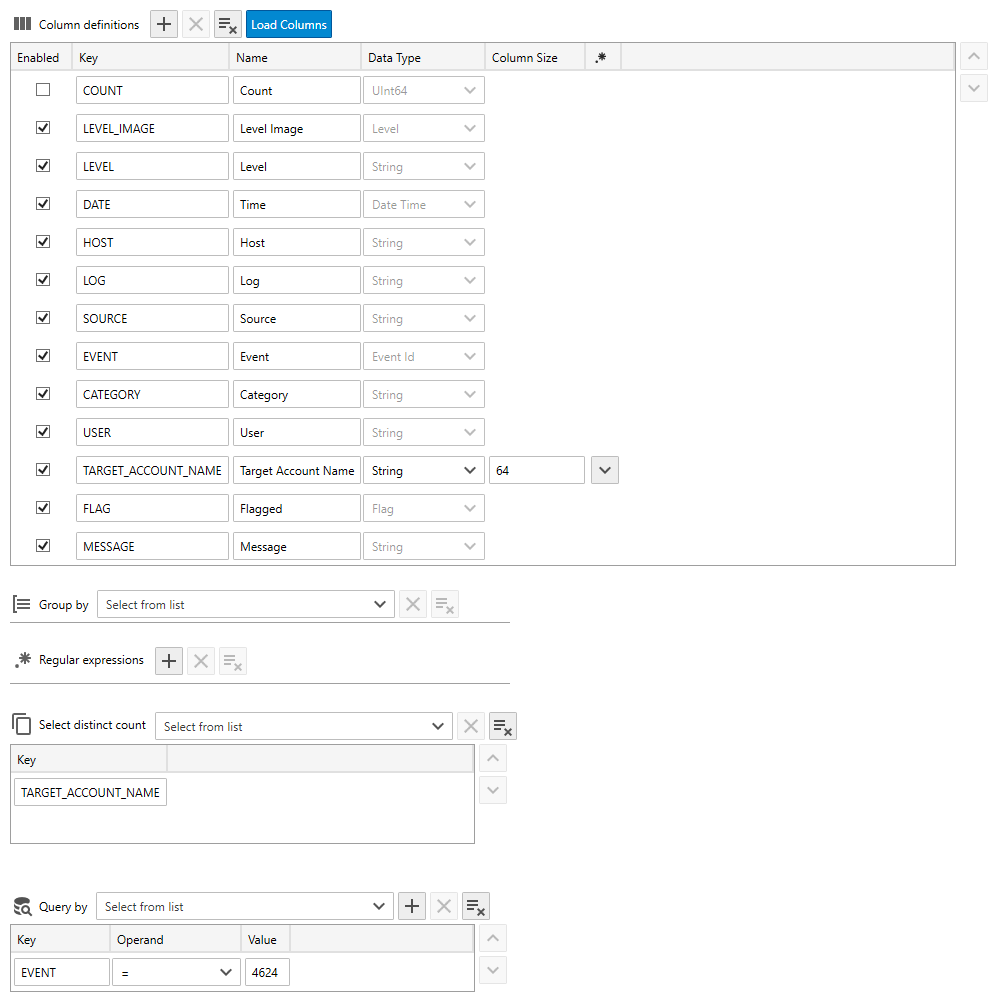
AI Anomaly Detection Column Definition Properties View
The Options Tab
Use this view to configure the AI machine learning rules.
- Use the Type drop-down so select the machine learning algorithm to apply.
| Algorithm | Description |
|---|---|
| Spike | Predicts spikes in independent identically distributed (i.i.d.) time series based on adaptive kernel density estimations and martingale scores. |
| Change Point | Predicts change points in an independent identically distributed (i.i.d.) time series based on adaptive kernel density estimations and martingale scores. |
| Seasonality | This method detects this predictable interval (or period) by adopting techniques of fourier analysis. |
- Use the Column definitions controls to specify the columns to include in the report. NoteThe previously assigned Select distict column are automatically added to the 3rd column in the table.
- Use the Sort by drop-down to select the columns to sort by.
- Use the Group by time span to group anomaly periods.
Spike
- Use the Confidence slider to fine tune the anomaly detection confidence.
- Use the Sub type drop-down to determine whether to detect positive or negative anomalies, or both.
| Option | Description |
|---|---|
| Negative | Only negative anomalies are detected. |
| Positive | Only positive anomalies are detected. |
| Two Sided | Both positive and negative anomalies are detected. |
Source: Anomaly Side Enumeration
Change Point
- Use the Confidence slider to fine tune the anomaly detection confidence.
- Use the Sub type drop-down to select the martingale used for scoring.
| Option | Description |
|---|---|
| None | No martingale is used. |
| Power | The Power martingale is used. |
| Mixture | The Mixture martingale is used. |
Source: Martingale Type Enumeration
Seasonality
- Use the Threshold slider to fine tune the anomaly detection threshold.
- Use the Sensitivity slider to fine tune the anomaly detection sensitivity.
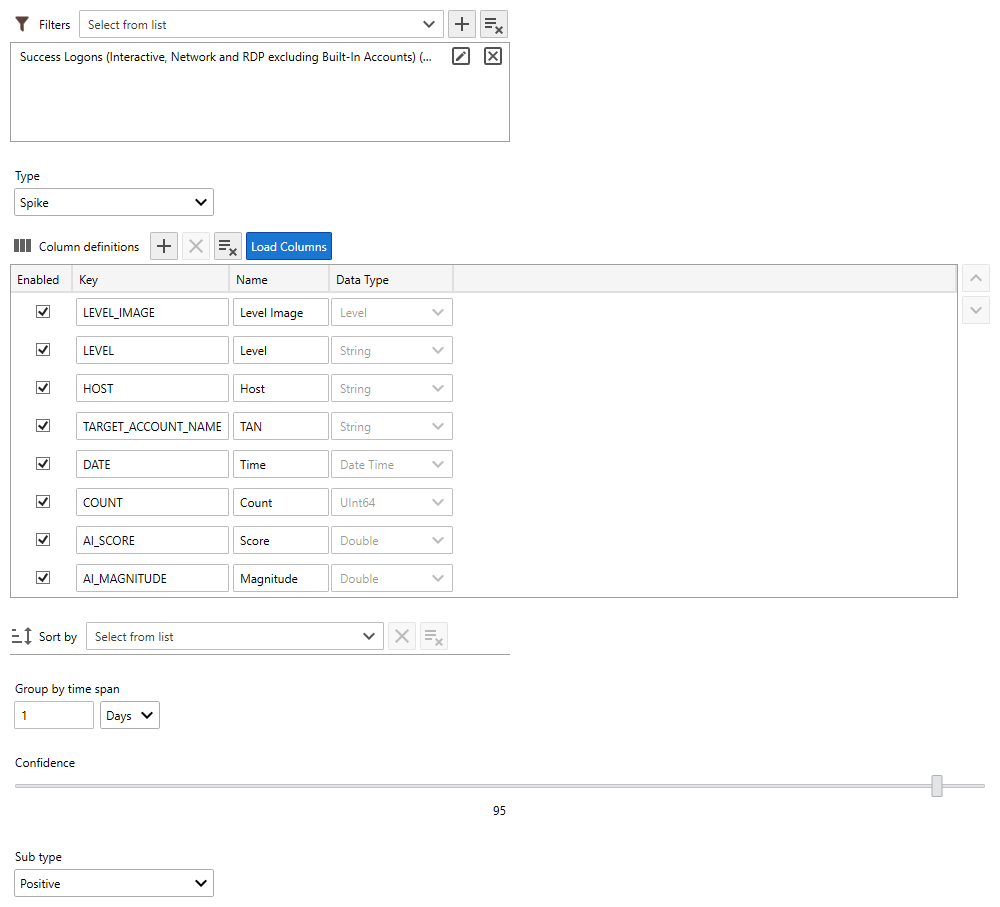
AI Anomaly Detection Options Properties View