Table of Contents
- Getting Started
- Agent-Based Management
- Common Tasks
- Data Providers
- Directory Services
- Auditing
- Hosts
- Templates
- Template Properties
- Batch Update Templates
- Assign Templates
- Log Management Templates
- SCAP Compliance Monitor
- Active Directory User Monitor Templates
- File and Directory Monitor Templates
- Windows Monitor Templates
- CPU Monitor Template
- Memory Monitor Template
- Disk Space Monitor Template
- Account Lockout Monitor Template
- Audit Policy Monitor Template
- Logon As Monitor Template
- Logon Monitor Template
- Performance Counter Monitor Template
- PowerShell Template
- Process Monitor Template
- RDP Session Monitor Template
- Registry Value Monitor Template
- Service Monitor Template
- SMART Disk Monitor Template
- System Security Monitor Template
- Windows Update Template
- WMI Query Template
- Task Scheduler Template
- Clock Synchronization Template
- Defragment NTFS Disks Template
- Network and Application Monitor Templates
- SSL Certificate Monitor Templates
- Database Templates
- Email Monitor Templates
- SNMP Monitor Templates
- Windows Accounts Templates
- Monitors
- Reports
- Auto-Configurators
- Filters
- Actions
- Schedules
- Environment Variables
- Options
- SNMP
- SSH Shell
- Syslog
- System Reset
- Shared Views
- Active Directory User and Group Filters
- Assign Actions
- Assign Azure Audit Logs
- Assign Consolidated Logs
- Assign Directories
- Assign Disks
- Assign Event Logs
- Assign Files
- Assign Services
- Assign Shares
- Auto-Config Host Assignment Properties
- Define CSV and W3C Log Entry Columns
- Define Log Entry Columns
- Define Log Entry Columns with Regular Expressions
- Executable Status
- Executable Timeline
- Explicitly Assigned Logs
- File Explorer
- General Executable Properties
- Report Columns
- Report Date/Time Ranges
- Report Security Event Log Filters
- Select Folder or File
- Target Files and Sub-Directories
- Command Line Interface
- Server Configuration
- Agent Configuration
- Troubleshooting
- Best Practices
- Terminology
Data Providers
Data Providers have three purposes:
- To save log entries, PowerShell results, and SNMP Traps to a centralized log database for a period of time such as 1 year.
- To save monitor history for internal review, charting and external BI Dashboards.
- To configure database connections for Database Monitoring Templates.
How it works:
When storing log entries for long periods of time, such as one year, log entry tables will become quite large. Running daily reports, such as Account Management Reports, require table scans to isolate the target log entries. If we were to store each log in a single table for the entire year, daily reports would be unnecessarily table scanning irrelevant data burning CPU, memory, power and time. For this reason, Corner Bowl saves log entries to two tables is separate databases. This design has two advantages. First, daily reports only need to execute table scans against recent data, and second, archive databases can be implemented on alternate hardware, with different specifications, while simultaneously isolating CPU intense archive reporting from production systems. Corner Bowl Server Manager implements these two databases in the Explorer View under Data Providers. By default, the databases are called the Primary Log Databaseand the Archive Log Database respectively.
Each time a Monitor, Report or Auto-Configurator runs, the execution results, such as the time the monitor started and completed, the trigger state and template specific column values such as Ping Response Time and CPU Load, are saved to a database table enabling you to link Server Manager's monitoring data to any BI Dashboard. You can locate the monitor specific database table information within each monitor's Timeline View . The Timeline View enables you to view the associated monitor's history table, view metadata about the table and view template specific data column names along with their data types, all the information you need to integrate with your organization's BI Dashboard.
To configure the Log Database:
- From the Explorer View, expand Data Providers. By default, the following two nodes are listed, Log Database and Archive Log Database.
- Right click on the database you would like to configure, then select Properties. The Data Providers Properties view displays.
- From the Data Providers Properties view, use the Name text box to specify a unique name.
 button to automatically generate a name. If you click this button after you have set the data provider settings, the generated name reflects the settings you have selected (e.g. Primary Log Database (SQL Server)).
 - Use the Type drop-down to select the database type. The following Types are available:
| Type | Description |
|---|---|
| SQLite | A self-contained open-source SQL database engine. |
| Microsoft SQL Server | Microsoft SQL Server v2022-2012. |
| MySQL | Oracle MySQL v8.x-5.7 |
| File System | A proprietary Corner Bowl Software developed binary flat file system. |
- Use the Role drop-down to select how you would like to use the database. The following Roles are available:
| Role | Description |
|---|---|
| Log Database | Contains the latest consolidated log entries. (e.g. log entries less than 15 days old). |
| Archive Log Database | Contains archived consolidated log entries previously saved to the Log Database (e.g. log entries 15 days and older). |
| Auxiliary Log Database | Contains auxiliary or backup consolidated logs. Typically used to view old database backups for auditing purposes. |
| History Database | Contains monitor and report execution history (e.g. execution time, state, and results such as the number of entries downloaded). |
| None | This setting has two purposes. First, to be used by Database Monitoring Templates. Second, to be used to maintain database connection settings for later use. |
- Use the rest of the controls to set the Type specific settings. For more information see:
- Click the Save button to save the settings.
To view a executable's Timeline:
The executable timeline graphically displays the execution history of Monitors, Reports and Auto-Configurators over time. This includes metadata about each executable's database history table enabling you to identify the table name and columns to integrate with your organization's BI Dashboard (e.g. Microsoft Power BI). For more information see: Timeline View.
To configure a database connection to be used by a Database Monitoring Template:
- From the Menu Bar, select File | New. The Create New Object View displays.
- From the Create New Object view, select Data Provider. The New Data Provider view displays.
- From the New Data Provider view, use the Type drop-down to select the database type.
- From the Role drop-down, select None.
- Use the rest of the controls to set the Type specific settings.
- Click Save to save your changes.
To view the Data Provider Index:
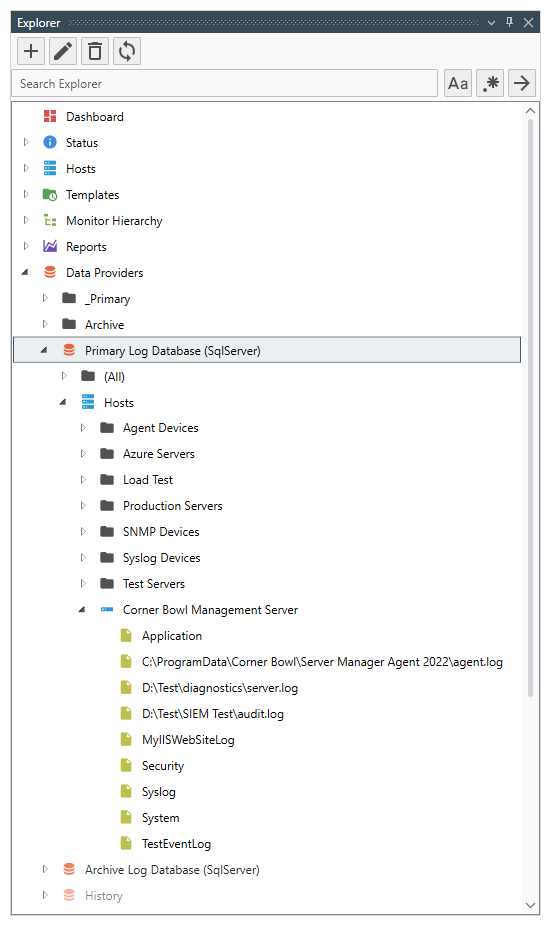
- To see what has been saved to the database, from the Explorer View, find the root Data Providers node then expand.
- Next, expand the Primary Log Database.
- Once expanded you will find two nodes, All and Hosts.
- Expanding All reveals each host that contains saved log entries without any grouping.
- Expanding Hosts reveals your root Hosts node structure.
- Expanding any host reveals all saved logs.
- To view a log, right click then select View.
To view Consolidated Log Database Summary:
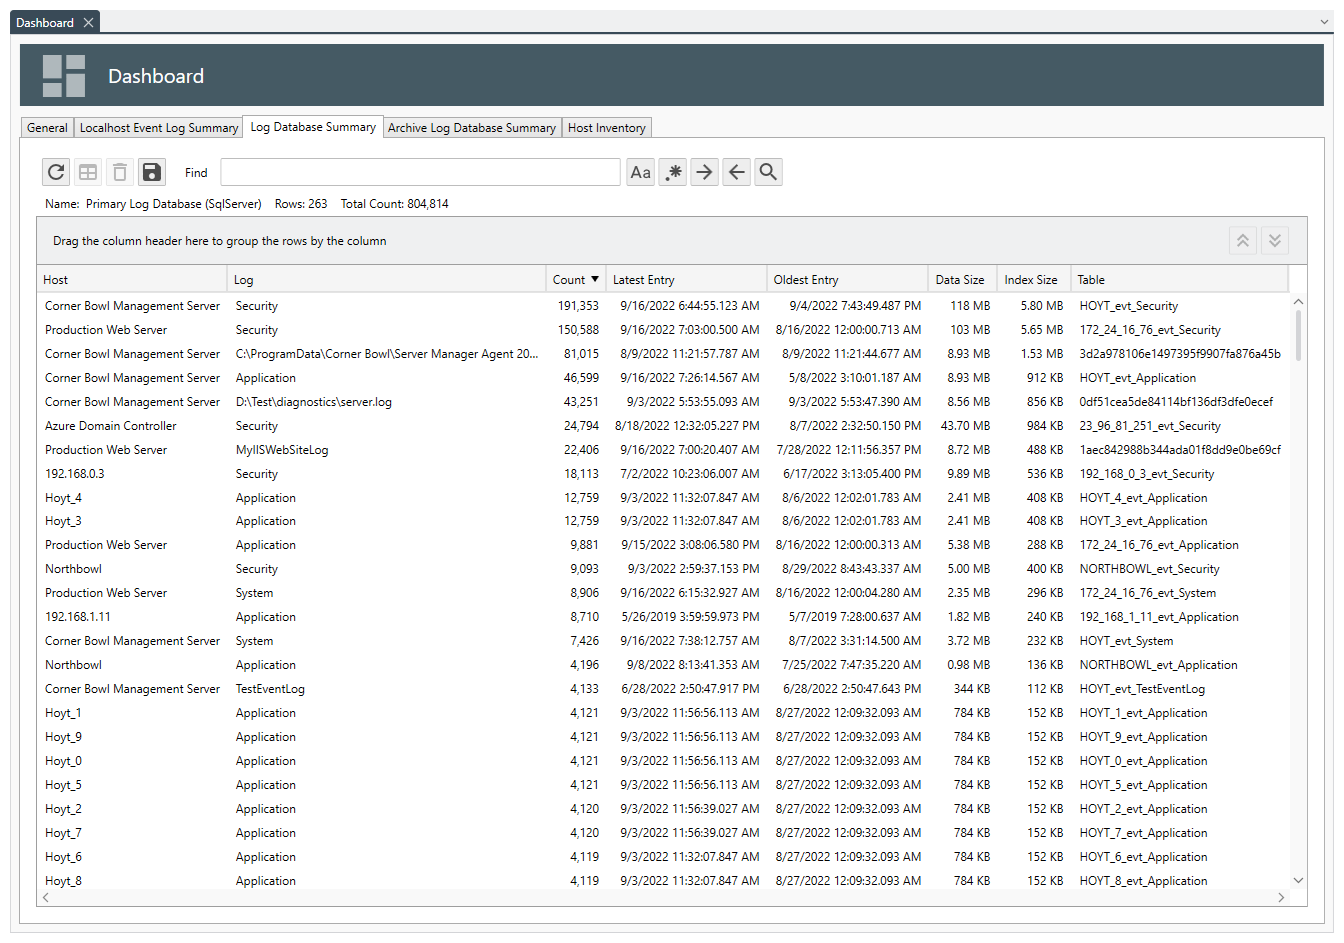
- To view a summary of the content in your primary log database, from the Explorer View, select the Dashboard node. The Dashboard View displays.
- From the Dashboard View, select the Log Database Summary Tab. The summary is executed and asynchronously return results one by one as they are received.
- Notice the scroll bar at the bottom. The summary may take several minutes to complete.
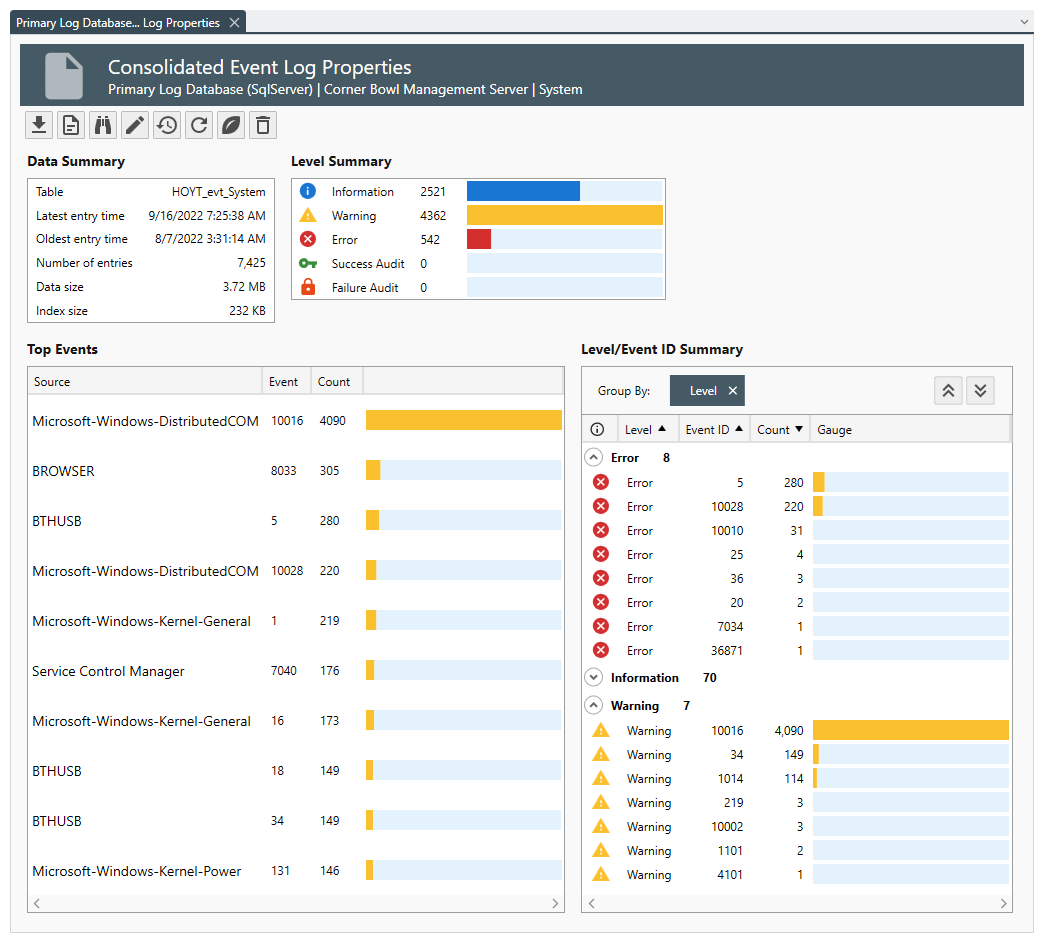
- To view more detail about a specific saved log, right click on the row then select Data Properties. The Data Properties View displays.
- Depending on the log type the Data Properties View will display summary data, for example, the number of Event Log Entries grouped by Level and Event ID.